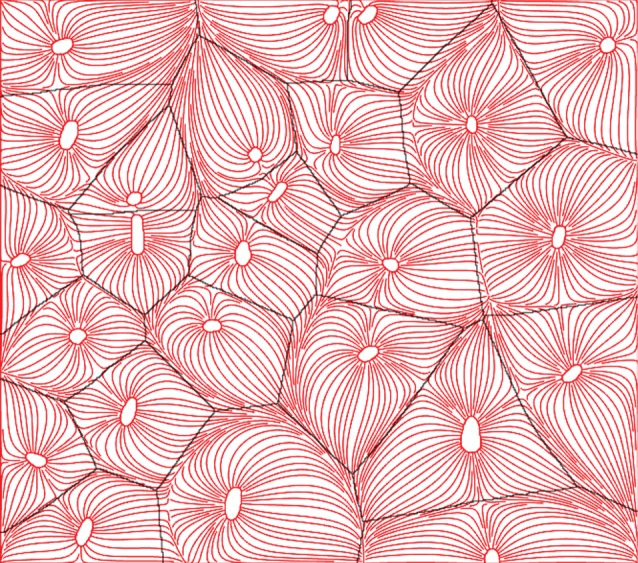
Figure 6.

Voronoi tessellations versus trapping regions to mark regions of oxygenation. Voronoi polygons are marked black and streamlines in red flowing from capillaries. The trapping regions are defined as the limits of the streamlines. The centres of the Voronoi polygons were defined as the geometric centres of the capillaries. It can be seen that Voronoi polygons and trapping regions match well. Inspired by [139]. (Online version in colour.)
