Table 1.
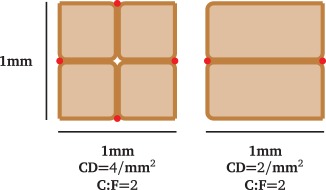
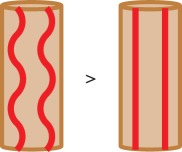
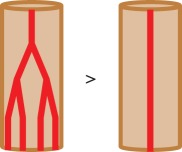
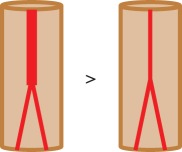
Structural measures used to characterize muscle oxygenation. The most common measures are shown that are used to identify and compare (micro)vascular capability to supply skeletal muscle tissue with oxygen. (Online version in colour.)
| parameter | definition | example | advantages | disadvantages | reference |
|---|---|---|---|---|---|
| capillary density (CD) | no. of capillaries per muscle area |  |
— easy to compute — easy to automate |
— dependent on fibre size and type — 2D measure |
— 476 ± 12 mm−2 in rat soleus [23] |
| capillary-to-fibre ratio (C : F) | no. of capillaries per muscle fibre | — gives information on metabolic activity — independent of fibre size — dependent on fibre type — easy to compute — easy to automate |
— 2D measure | — 2.30 ± 0.03 mouse soleus [22] — 2.17 ± 0.06 mouse soleus [24] — 1.83 ± 0.04 mouse soleus [25] |
|
| tortuosity |  |
 |
— easy to automate | — not related to oxygen demand but sarcomere length — different definitions available — connected vessel network required |
— 1.86 ± 0.06 in healthy rat soleus versus 1.19 ± 0.10 in diabetic rat [26] |
| length density |  |
 |
— indication for available oxygen exchange length | — no information on exchange volume — may differ from original stereological definition — depends on tortuosity |
— 1.88 ± 0.07 × 103 mm2 mouse soleus [24] — 12.06 ± 0.90 × 103 mm mouse soleus total capillary length [25] |
| volume fraction |  |
 |
— indication for available oxygen exchange volume | — no information on exchange length — computationally expensive |
— 0.07 ± 0.01 in healthy rat soleus versus 0.03 ± 0.01 in diabetic rat [26] |
