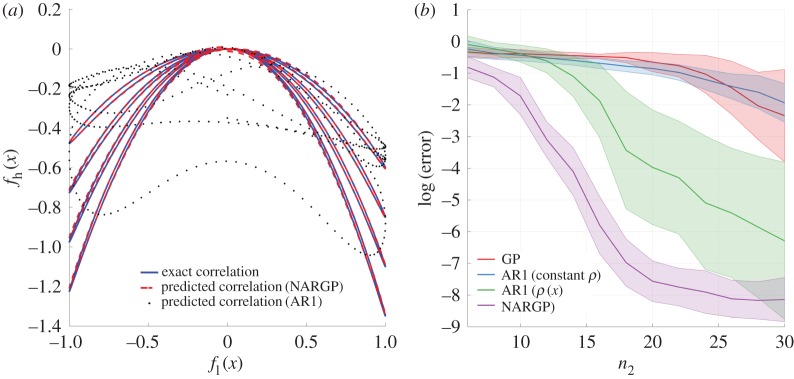
Figure 3.
A pedagogical example: (a) cross-correlation structure between the exact low- and high-fidelity signals versus the cross-correlation learnt by the NARGP and AR1 schemes trained on the given multi-fidelity dataset. (b) error between the exact high-fidelity signal and the computed posterior mean of the GP, AR1 (constant and input-dependent ρ) and NARGP models, as the number of high-fidelity training points is increased. Shaded regions represent 1 standard deviation from the mean. (Online version in colour.)

