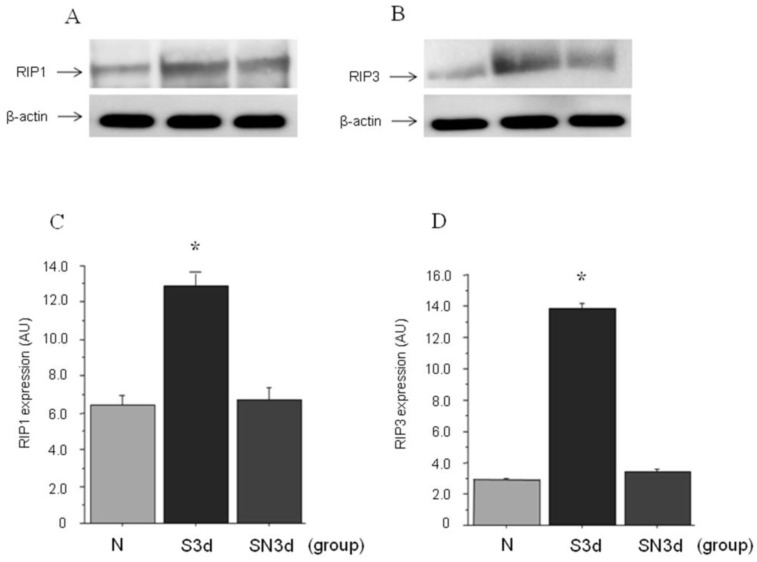
Figure 2.
Western blot study. A. expression of RIP1; B. expression RIP3. C, D. quantification of RIP1 and RIP3 expression by Western blot. RIP1 induced significantly increased expression in S3d group, while with Nec-1 administration it was significantly inhibited to the same degree as N group. RIP3 like RIP1 showed significantly increased expression in S3d group, while with Nec-1 administration it was significantly inhibited to the same degree as N group.(*: p<0.001)

