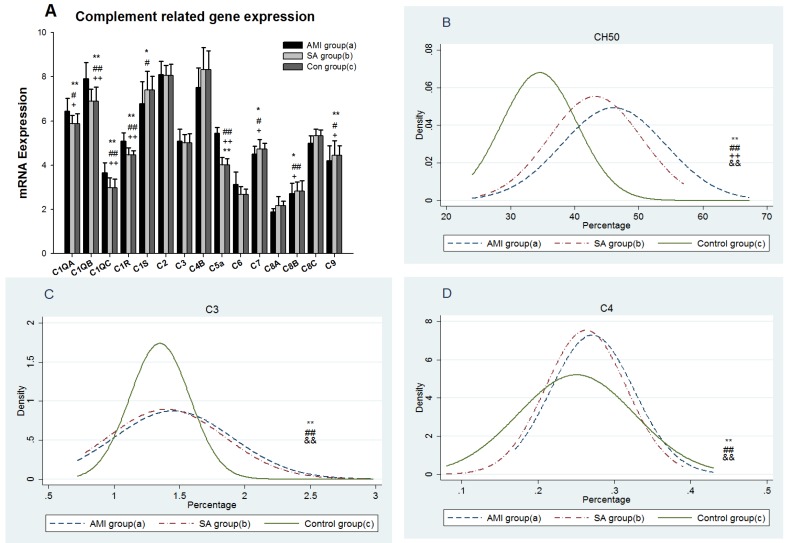
Figure 1.
From three groups in PBMCs, (A) mRNA expression of early and late components complement. (B) Serum CH50 level. (C) Serum C3 level. (D) Serum C4 level. Three groups: *, P<0.05; **, P<0.01. AMI vs. Con: #, P<0.05; ##, P<0.01. AMI vs. SAP: +, P<0.05; ++, P<0.01. SAP vs. Con &: P<0.05; &&: P<0.01.

