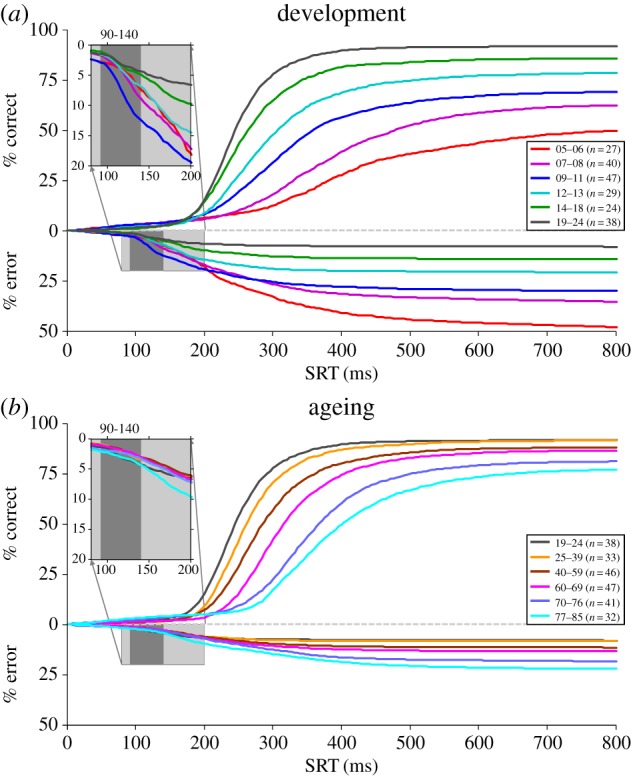
Figure 4.

Cumulative distributions of reaction times for correct anti-saccades (values above zero on ordinate) and direction errors (values below zero on ordinate). Different colour curves represent different cohorts of healthy human subjects across different ages to highlight dramatic changes across development (a) and ageing (b). The light grey inserts highlight the triggering of express direction errors in the different groups. The express epoch is shaded dark grey.
