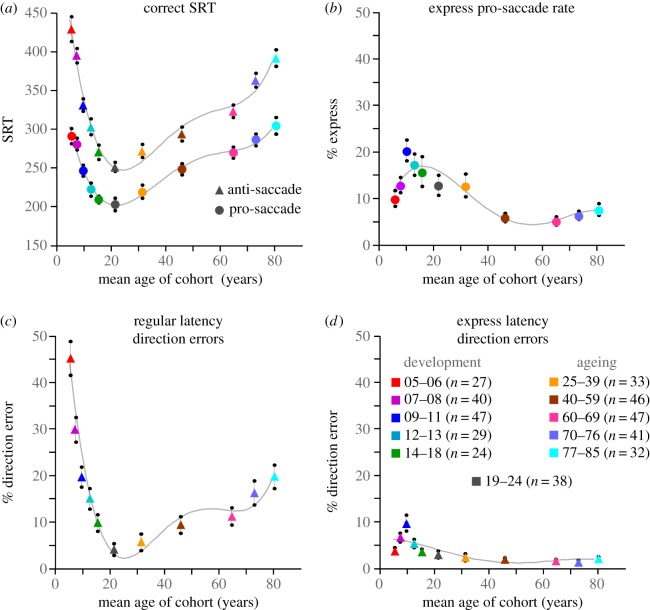
Figure 5.
Summary of pro- and anti-saccade behaviour across the lifespan for the same cohorts of healthy subjects illustrated in figure 4. (a) Mean SRT for correct pro (circles) and anti (triangles) saccade trials. (b) Percentage of trials with express latency saccades in the pro-saccade task. (c,d) Percentage of anti-saccade trials with direction errors in the express (d) or regular (c) latency epoch.

