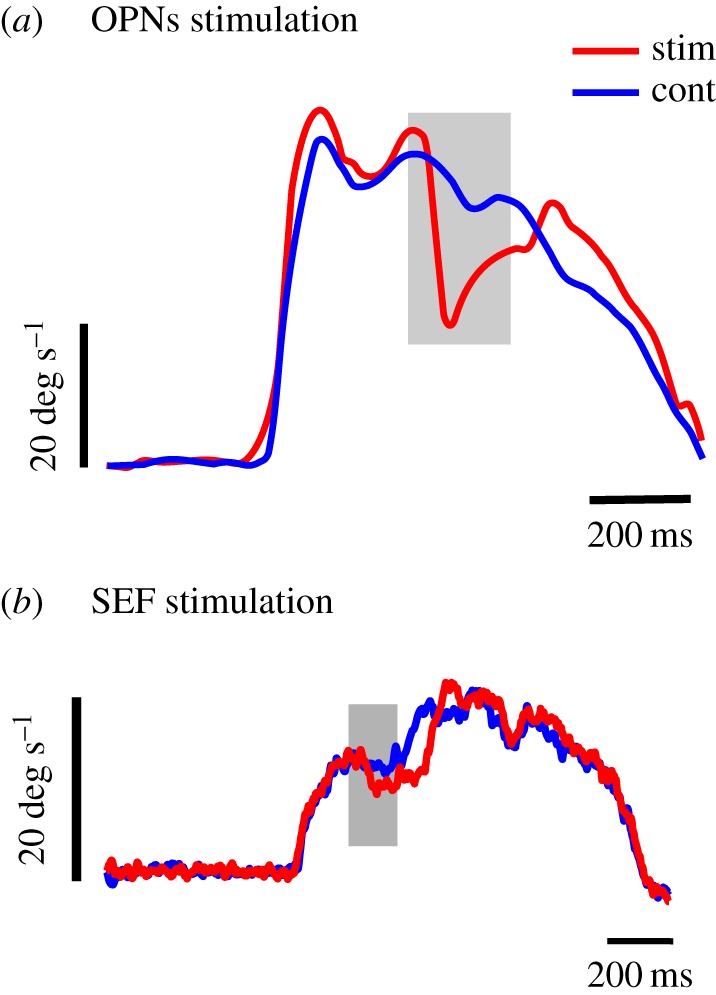
Figure 5.

Smooth pursuit inhibition. (a) Smooth pursuit deceleration induced by electrical stimulation in the OPNs’ region (15 µA, 400 Hz) during the period indicated with a grey rectangle. Average eye velocity during trials without stimulation (blue trace; n = 8) and during electrical stimulation (n = 9; red trace). Redrawn from Missal & Keller [45]. (b) Smooth pursuit deceleration induced by electrical stimulation in the SEF region (n = 10 trials, 50 µA, 200 Hz) during the period indicated with a grey rectangle (S. J. Heinen 2017, personal communication). Same conventions as in (a).
