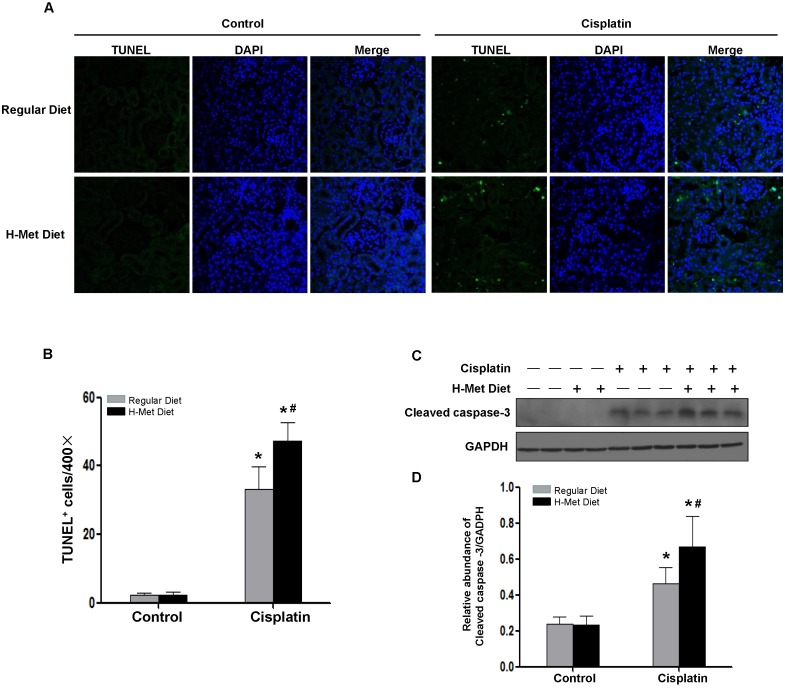
Figure 4.
HHcy aggravates cisplatin-induced renal tubular epithelial cell apoptosis in mice. (A) Representative micrographs show apoptotic cell death detected by TUNEL staining 3 days after cisplatin injection. (B) Quantitative determination of apoptotic tubular cells at day 3 after cisplatin injection. Data are presented as numbers of apoptotic cells per 400× field. (C) Representative Western blots show the protein level of cleaved caspase-3 in the kidneys at day 3 after cisplatin injection. GAPDH was used to verify equivalent loading. (D) Graphic representation of relative level of cleaved caspase-3 normalized to GADPH. Data are expressed as mean±SD, n=5. *P<0.05 versus control mice. #P<0.05 versus mice fed with regular diet.

