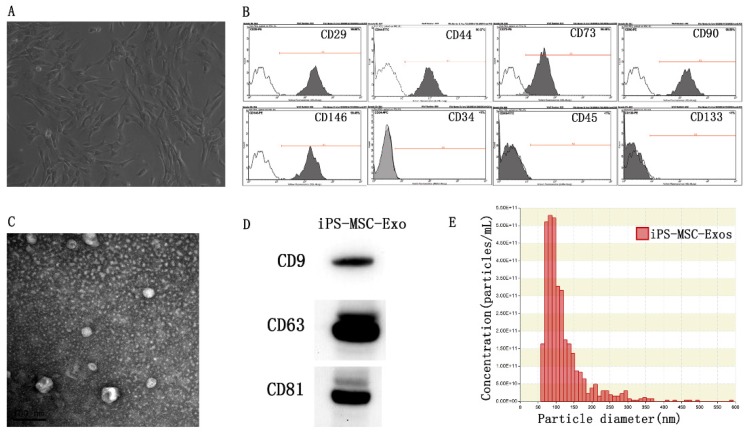
Figure 1.
Characterization of hiPS-MSCs and hiPS-MSC-Exos. (A) The fibroblast-like morphology of hiPS-MSCs shown in light microscopy images. (B) Surface markers of hiPS-MSCs analyzed by flow cytometry. (C) The morphology of hiPS-MSC-Exos shown by transmission electron microscopy. (D) Expression levels of CD9, CD63 and CD81 incorporation into hiPS-MSC-Exos shown by western blotting. (E) Identification of size and concentration of hiPS-MSC-Exos by nanoparticle analysis.

