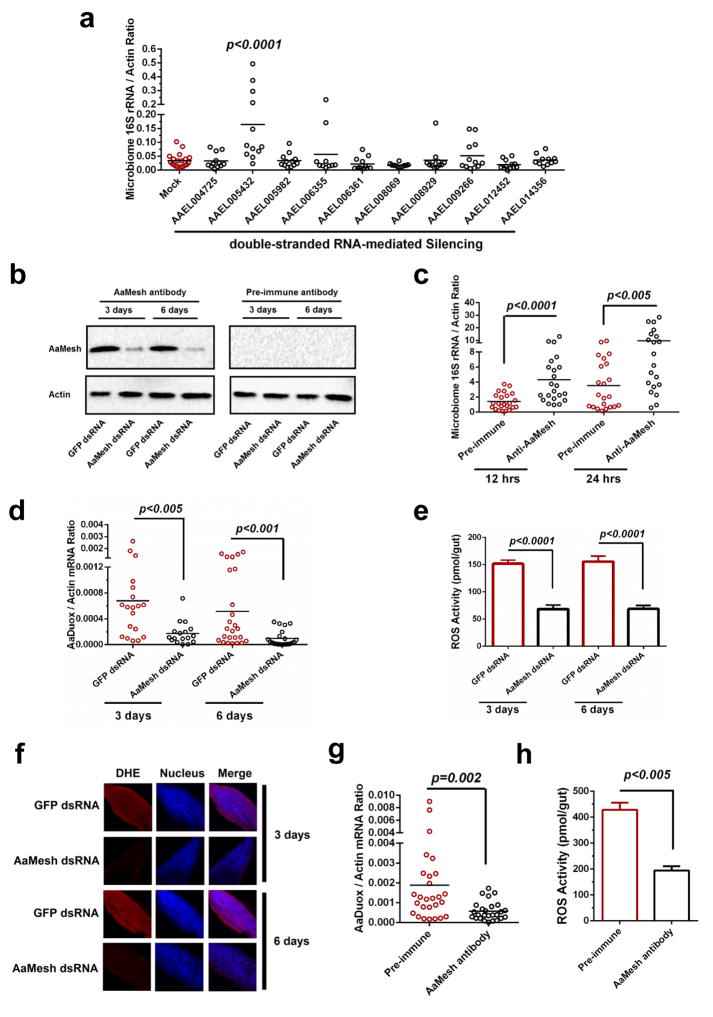
Figure 1. Mesh maintains gut microbiome homeostasis by controlling AaDuox expression in A. aegypti.
(a) The roles of the CCP genes in the maintenance of the gut microbiome in A. aegypti. The genes were individually silenced via thoracic microinjection of dsRNA. The results were combined from 2 independent experiments.
(b) Validation of an AaMesh antibody in the guts of AaMesh-silenced mosquitoes. The amount of AaMesh was assessed via immuno-blotting with a murine AaMesh antibody in the mosquito lysates. Pre-immune serum served as a negative control. A total of 50 μg of protein from mosquito lysates was loaded into each lane.
(c) Immuno-blockade of AaMesh enhanced colonization of gut bacteria in the midgut of A. aegypti. The burden of the gut microbiome was detected by SYBR Green qPCR.
(d–f) Regulation of both Duox expression (d) and ROS activity (e and f) in the guts of AaMesh silencing mosquitoes. The GFP dsRNA-treated mosquitoes served as mock controls. ROS activity was measured by H2O2 assay (e) and Dihydroethidium staining (DHE) (f). (f) Nuclei were stained blue with To-Pro-3 iodide. Images were examined using a 10×objective lens on a Zeiss LSM 780 meta confocal microscope.
(g–h) Immuno-blockade of AaMesh impaired both Duox expression (g) and ROS activity (h) in the mosquito guts. The midguts of were collected at 18 hours after a blood meal. ROS activity was detected by H2O2 assay.
(a, c, d, g) In the mosquito midguts, the gene expression was determined by SYBR Green qPCR and normalized against A. aegypti actin (AAEL011197). The qPCR primers are described in Supplementary Table 6. One dot represents one gut. The horizontal line represents the mean value of the results.
(c, g, h) The murine AaMesh antibody, in a 100-fold serial dilution, was premixed with fresh mouse blood for the mosquito blood meal. Pre-immune serum at the same dilution served as a negative control.
(e, h) The data are presented as the mean ± S.E.M.
(a, c, d, e, g, h) The data were analyzed using the non-parametric Mann-Whitney test.
(b–h) All results were repeated in at least 3 independent experiments.

