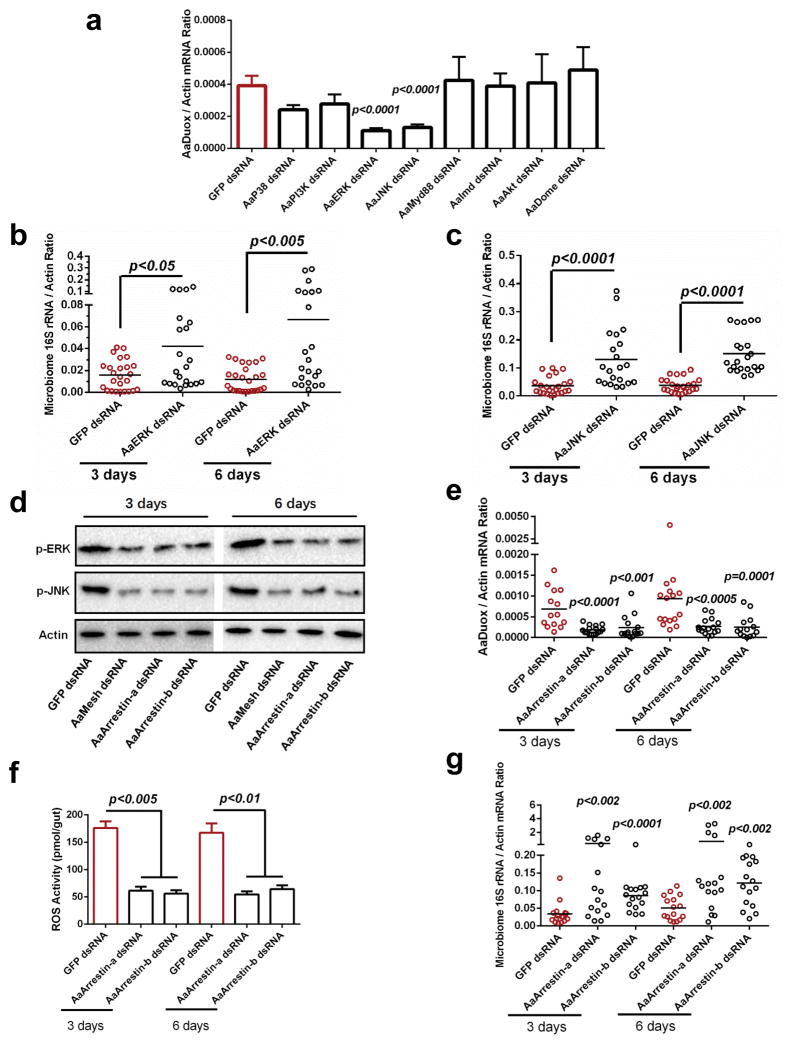
Figure 3. Mesh regulates AaDuox expression via Arrestin-mediated MAPK phosphorylation in A. aegypti.
(a) The role of immune signaling pathways in regulating Duox expression in the midgut of A. aegypti. The genes of immune signaling components were knocked down by dsRNA thoracic inoculation. Six days later, the abundance of the Duox gene was determined in the midgut of A. aegypti by SYBR Green qPCR.
(b–c) Knockdown of AaERK and AaJNK enhanced the burden of the gut microbiome in A. aegypti. Both AaERK and AaJNK were silenced by dsRNA thoracic inoculation in A. aegypti. The midguts were isolated 3 and 6 days after gene silencing, and the burden of the gut microbiome was subsequently determined by SYBR Green qPCR.
(d) Genetic suppression of AaMesh and AaArrestins impaired the phosphorylation of AaERK and AaJNK in the mosquito guts. AaMesh and AaArrestins were silenced by dsRNA thoracic inoculation in A. aegypti, respectively. The midguts were isolated 3 and 6 days after gene silencing, and the phosphorylation of AaERK (p-ERK) and AaJNK (p-JNK) were subsequently determined by western blotting. A total of 50 μg of protein from mosquito gut lysates was loaded into each lane.
(e–f) Reduction of Duox expression (e) and ROS activity (f) in the guts of AaArrestins-silenced mosquitoes. The midguts from the dsRNA-treated mosquitoes were isolated for the detection of Duox expression (e) by SYBR Green qPCR and for measuring ROS activity using a H2O2 assay (f). (f) The data are presented as the mean ± S.E.M.
(g) Silencing AaArrestins increased the load of the gut microbiome in A. aegypti.
(a, b, c, e, g) The GFP dsRNA-treated mosquitoes served as mock controls. The gene expression was determined by SYBR Green qPCR and normalized against A. aegypti actin (AAEL011197). The qPCR primers are described in Supplementary Table 6. One dot represents one gut. The horizontal line represents the mean value of the results.
(a, f) The data are presented as the mean ± S.E.M.
(a–c, e–g) The data were analyzed using the non-parametric Mann-Whitney test.
(a–g) All results were repeated in at least 3 independent experiments.

