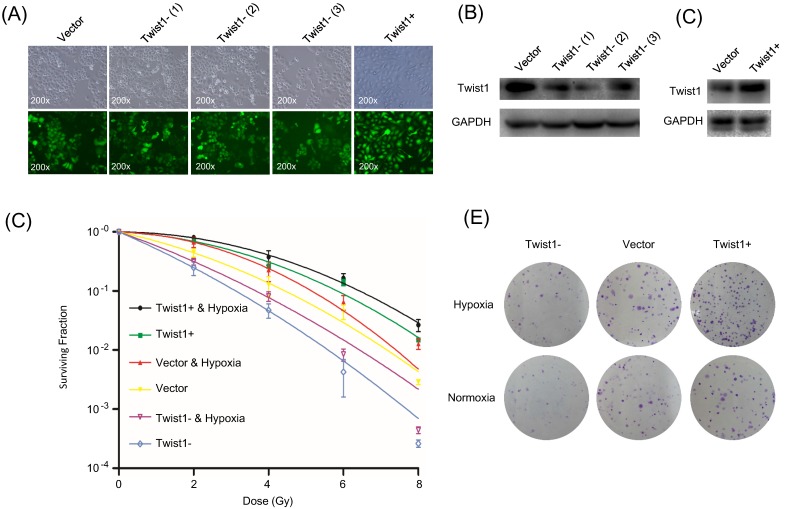
Figure 1.
The change of protein levels of Twist1 in SiHa cells after lentivirus infection and following impact on the radiosensitivity of SiHa cells. (A) Fluorescence microscopy of SiHa cells infected with different recombinant lentiviruses. Upper panel: bright field view; lower panel: fluorescence field view (GFP in green). ×200. (B) Protein level of Twist1 in negative control cells (Vector) and three different lines of SiHa-Twist1-siRNA cells Twist1- (1), Twist1- (2) and Twist1- (3). (C) Protein level of Twist1 in negative control cells (Vector) and SiHa-Twist1+ cells (Twist1+). (D) The survival curve of control cells (Vector), Twist1-overexpression (Twist1+) and Twist1 knockdown (Twist1-) SiHa cells under normoxia or hypoxia conditions. (E) Representative photographs of the colony formation assay after irradiation (single dose of 6 Gy).

