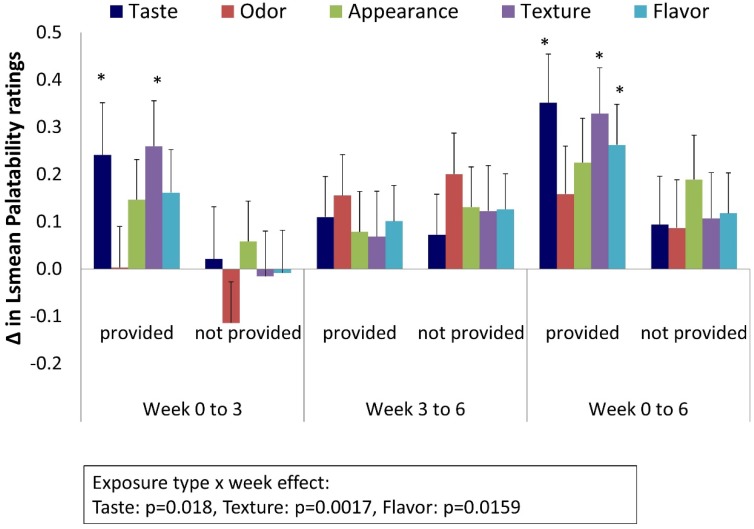
Figure 2.
Changes in palatability ratings over the six-week pulse intervention in provided and not provided foods. Changes were calculated by subtracting the adjusted mean at the earlier time point from the later time point. Values are presented as least square (LS) mean ± SEM (standard error of the mean). * There were significant week by exposure type interaction effects for taste (p = 0.018), texture (p = 0.002), and flavor (p = 0.016) (see Table 2 for p-values for changes from weeks 0 to 3 and weeks 0 to 6).

