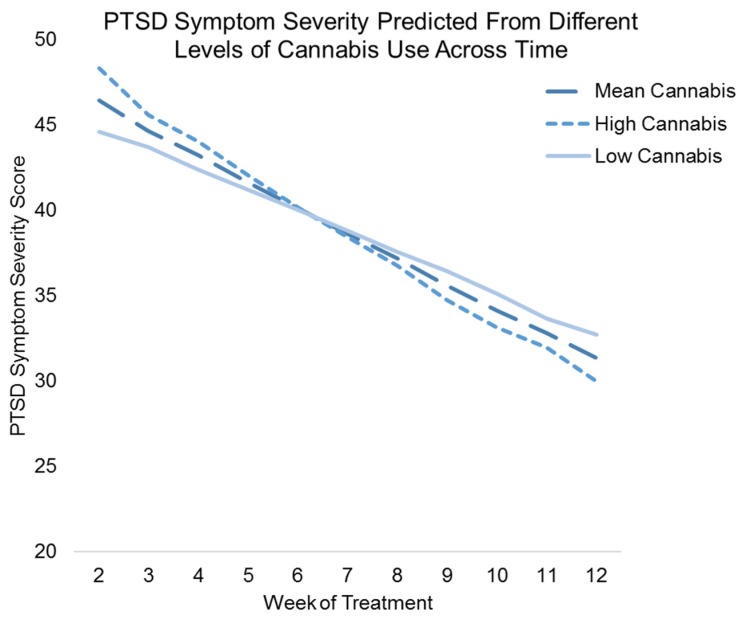
Figure 1.
Figure showing the adjusted results of weekly lagged cannabis use and weekly lagged cannabis use x time, predicting weekly PTSD symptom severity scores. The x-axis represents the time from week 2 of treatment to week 12 of treatment (week 1 is not represented because the independent variable is lagged one time-point), while the y-axis represents the predicted score on the PTSD symptom severity measure. Results show a crossover effect, whereby higher weekly lagged cannabis use was associated with greater weekly PTSD symptom severity early in treatment, but lower weekly PTSD symptom severity later in treatment.

