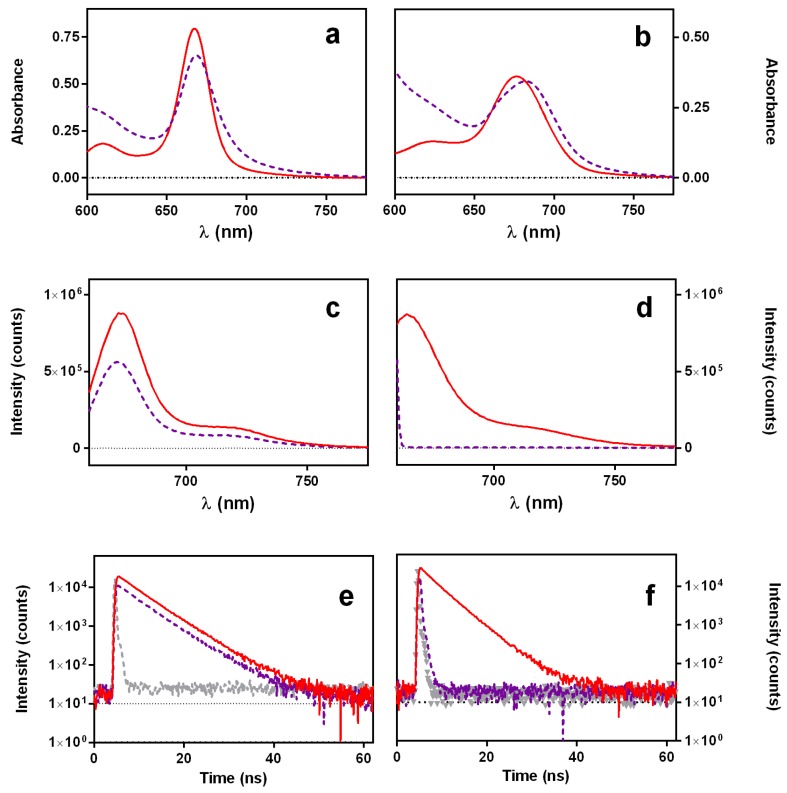
Figure 4.
Absorption spectra (a,b), fluorescence spectra (c,d) and fluorescence decay (e,f) of PhA 25 μM alone (red solid lines) and in the presence of 1 mM DOXO (dashed violet lines) in EtOH (left panels) and H2O (right panels) solutions. For TRF measurements, λexc = 654 nm and λobs = 750 nm. Grey dashed traces correspond to the instrument response function.

