Figure 6.
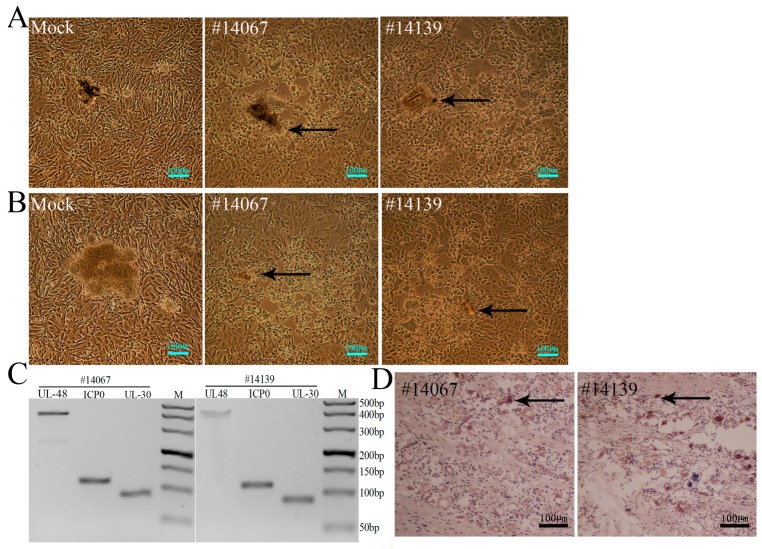
HSV1 was present in nervous tissues in a latent state one year post-infection. (A) co-cultured Vero cells with TG of No. 14067 and No. 14139. CPE is indicated by black arrows, scale bars = 100 µm; (B) co-cultured Vero cells with pons of No. 14067 and No. 14139. CPE is indicated by black arrows, scale bars = 100 µm; (C) viral genome detection of a mixture of TG tissues and co-cultured Vero cells by PCR amplification of DNA with primers against the UL48 (405 bp), ICP0 (114 bp) and UL30 (92 bp) genes; and (D) in situ hybridization of TG tissues of No. 14067 and No. 14139 using a specific LAT mRNA probe. Positive in situ hybridization results are indicated by black arrows, scale bars = 100 µm.

