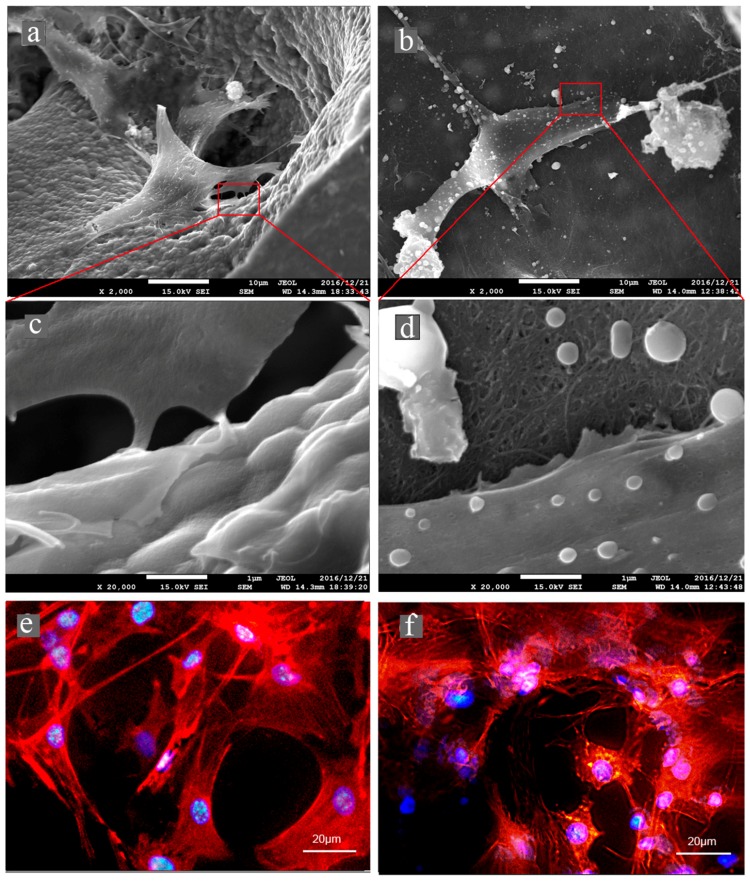
Figure 7.
MC3T3-E1 cells spreading on IP-CHA and CNTp scaffolds. Cells on (a,c,e) IP-CHA or (b,d,f) CNTp. SEM images of (a,c) IP-CHA and (b,d) CNTp. Original magnification is 2000× for (a,b) and 20,000× for (c,d). Cells labeled for actin filaments (red) and nucleus (blue) of (e) IP-CHA and (f) CNTp.

