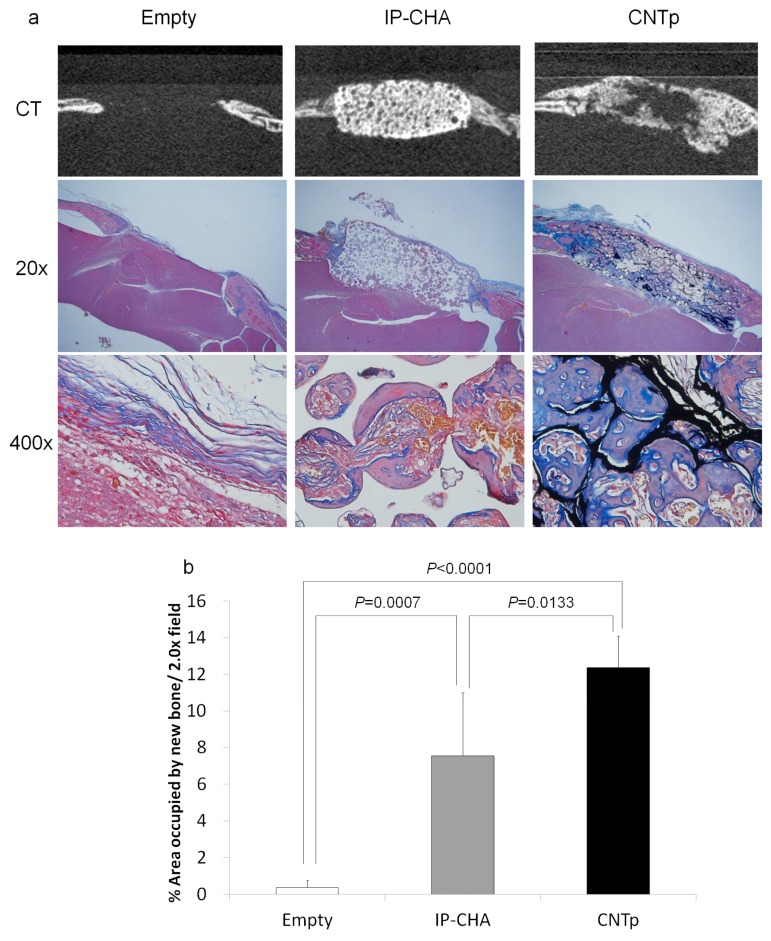
Figure 11.
(a) Micro-CT and histological image of empty control, IP-CHA, and CNTp scaffolds combined with rhBMP-2, implanted in the calvarial defects of ddY mice for three weeks; (b) A bar diagram showing the newly formed bone area/20× field in the calvarial defect of ddY mice implanted with rhBMP-2 supplemented scaffolds. Mean values were compared using one-way ANOVA, followed by Tukey’s post-hoc test (n = 5).

