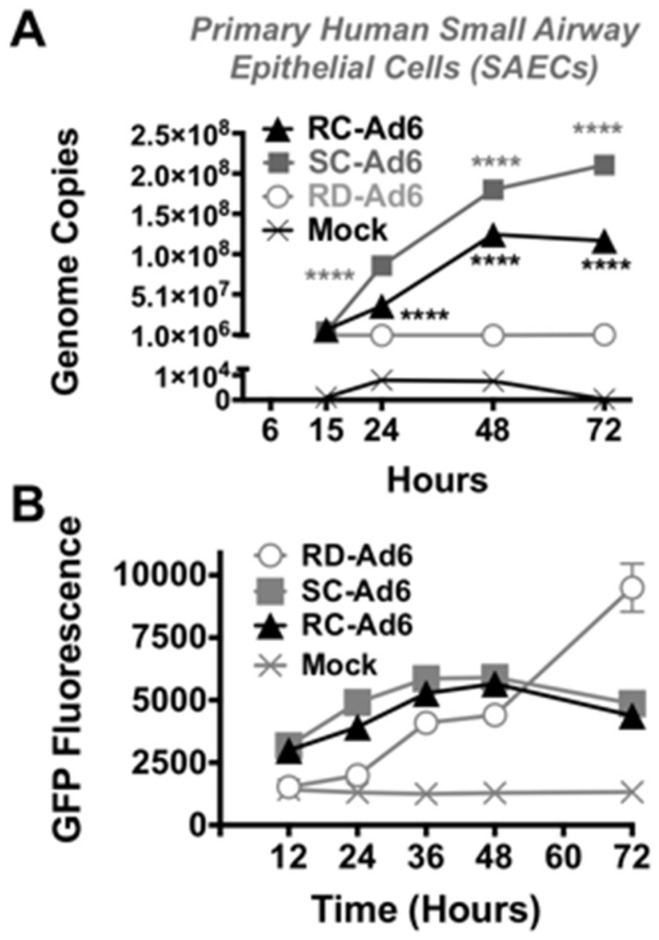
Figure 3.
DNA replication and green fluorescent protein (GFP) expression after infection with different Ad6 vectors. Cells were infected at 100 vp/cell and viral genomes were quantified by qPCR of cellular DNA at the indicated time points (A). **** indicates p < 0.0001 by two ANOVA (analysis of variance) for single cycle (SC)- and replication-competent (RC)-Ad when compared to RD-Ad and for SC-Ad vs. RC-Ad. GFP expression was measured by fluorescence measurement on a plate reader at the indicated time points (B).

