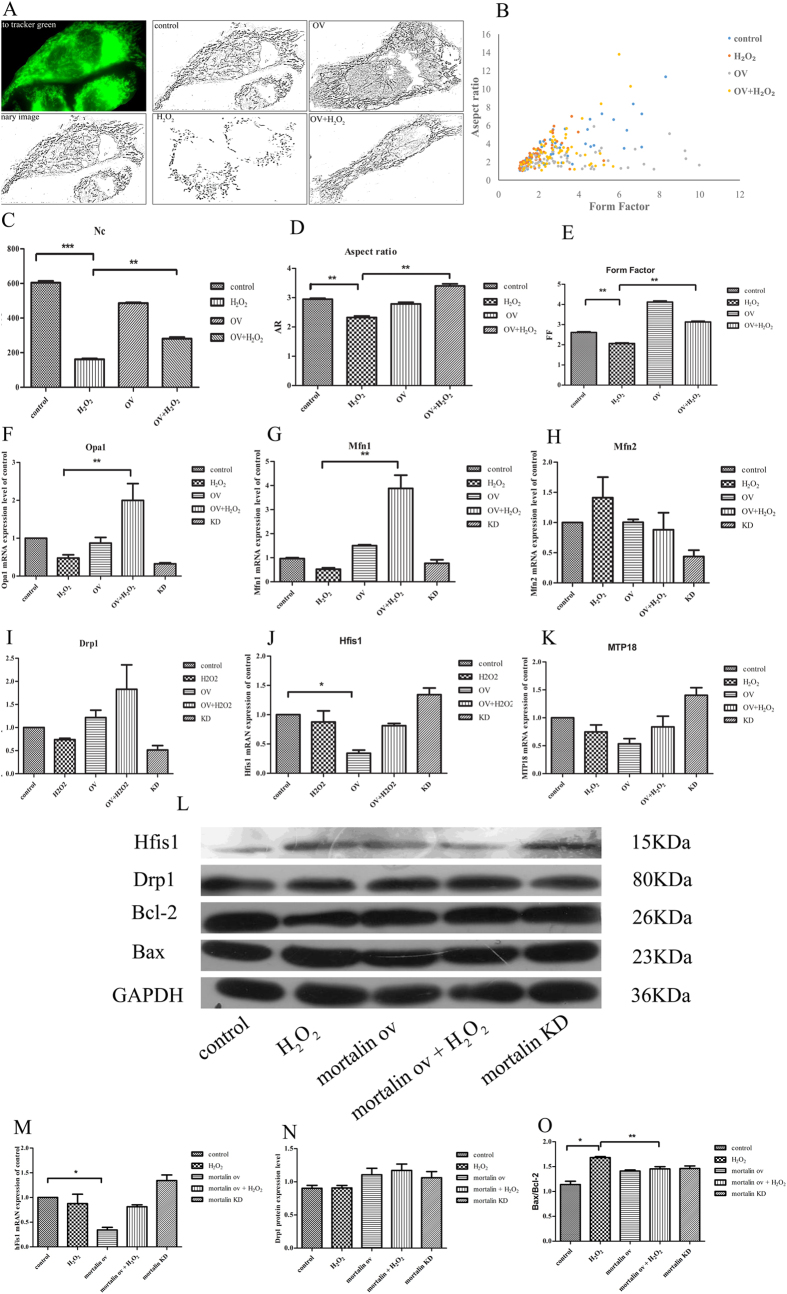
Figure 5. Effects of mortalin overexpression on mitochondrial fission and fusion.
(A) Mitochondria from control and mortalin-overexpression HL-7702 cells were labeled with the mitochondrial-specific dye MTG for 30 min at 37 °C and viewed with a fluorescence microscope. Cells grown in normal medium exhibit long, tubular mitochondria. Cells treated with H2O2 exhibit short, fragmented mitochondria. Mortalin overexpression inhibited mitochondrial truncation and fragmentation under H2O2 treatment. (B) The number of mitochondria in cells grown in H2O2 is significantly decreased compared with normal cells. (C,D) As mitochondrial morphological parameters, AR and FF were quantified by ImageJ software. Images from 15 individual cells were analyzed inthree independent experiments. *P < 0.05 versus H2O2-treated control. (E) The graph presents FF and AR values for individual mitochondrion. Mitochondria of cells grown in normal medium have increased FF and AR values corresponding to long, tubular mitochondria. Fragmented mitochondria have reduced FF and AR values. n = 50 mitochondria. (F–K) Real time PCR was used to analysis mitochondrial fusion factors Mfn1, Mfn2, and Opa1 and mitochondrial fission factors hFis1, Drp1 and MTP18. These factors were normalized to GAPDH mRNA expression. Three independent experiments are presented. Data are normalized as a percentage of the control group and represent means ± SEM, *P < 0.05 versus control group, n = 3. (L) Western blot analysis of hFis1, Mfn2, Bax, Bcl-2 levels in HL-7702 cell treatment with different concentration of SalB, SalB increased hFis1 protein level and inhibited Mfn2 protein expression. Full-length blots are presented in Supplementary Figure 4. (M–O) Quantitative results from Western blots. GAPDH was used as a loading control (*P < 0.05; **P < 0.01).

