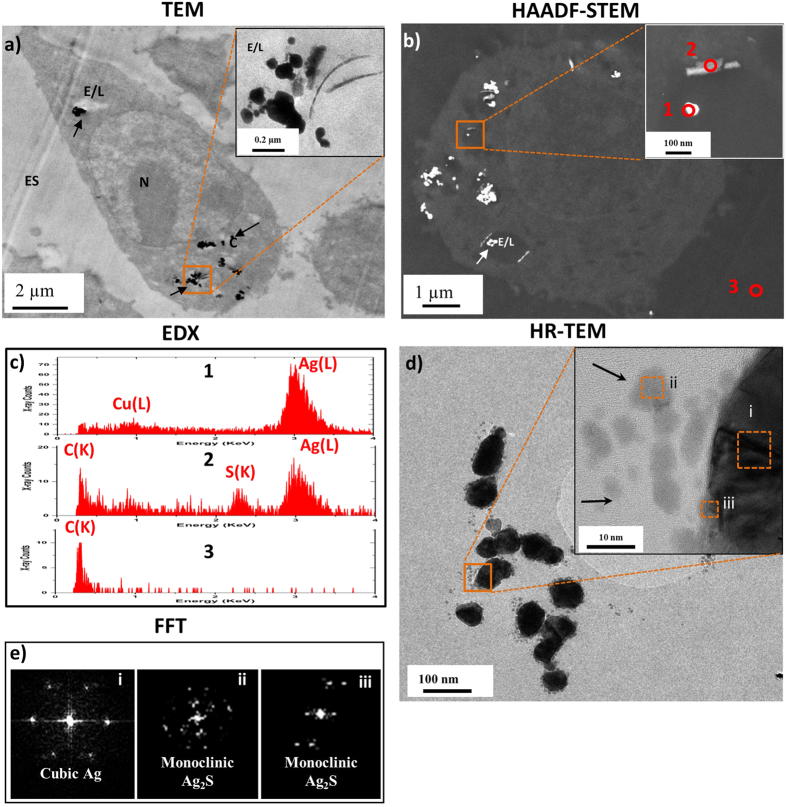
Figure 2. AgNP uptake and transformation by N9 microglia following a 1 hr pulse treatment (50 μg/mL) with 24 hrs chase period.
(a) TEM images showing the cellular uptake of AgNPs by microglia cells (N: nucleus; C: cytoplasm; E/L: endosome/lysosome; ES: extracellular space). (b) HAADF-STEM images showing the intracellular distribution of AgNPs and a corresponding higher magnification image of the boxed area. (c) STEM-EDX spectra acquired from corresponding areas 1–3 marked in (b). (d) TEM imaging of intracellular AgNPs with secondary particles in close poximity to, and partially coating the surface of AgNPs. (e) FFT patterns taken from corresponding areas (i–iii) marked in (d) reveal secondary particles are composed of Ag2S. Images are representative of >100 cells surveyed per experiment, from three independent experiments.

