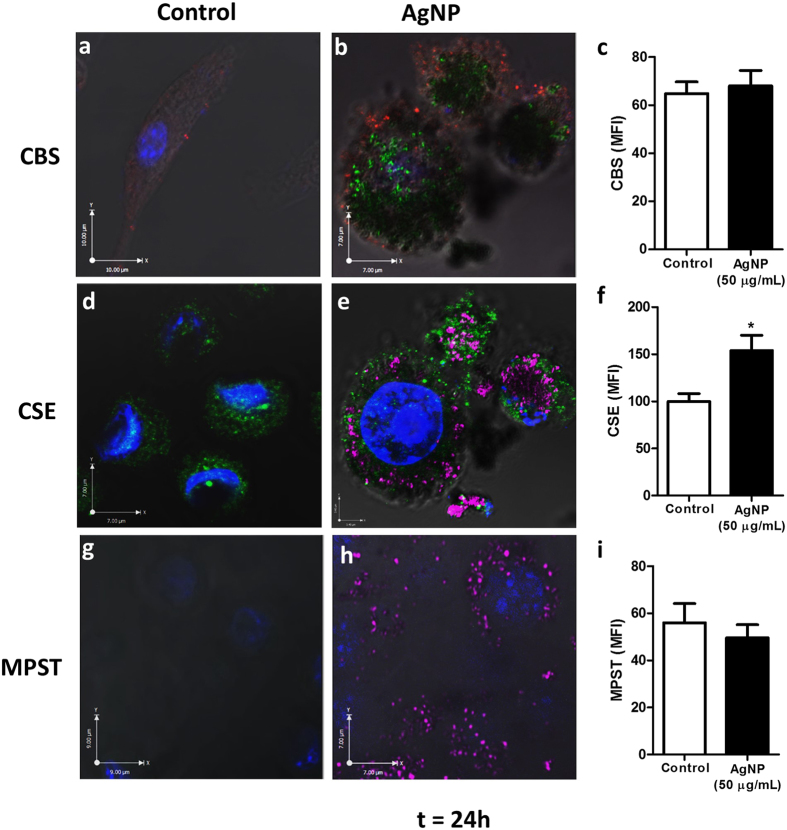
Figure 3. Cellular uptake and distribution of AgNPs combined with CBS, CSE and MPST enzymes expression in microglia.
N9 microglia were treated with AgNP (50 μg/mL) for 1 hr (pulse) followed by a 24 hrs chase period. Cells were immunostained and enzyme expression analysed through confocal microscopy. Confocal images of CBS (a,b), CSE (d,e) and MPST (g,h) enzymes in control (a,d,g) and AgNP-treated (b,e,h) microglial cells. For images (a,b), CBS = red; AgNP = green; DAPI = blue. For images (d,e,g,h) CSE/MPST = green, AgNP = magenta, DAPI = blue. White = colocalization of enzymes and AgNP. Images are representative of three independent experiments. The mean fluorescent intensity (MFI) of CBS (c), CSE (f) and MPST (i) immunoreactivity was measured from the confocal microscopy images using Image J analysis software. Results are displayed as mean ± SD of three independent experiments, quantifying 40 individual cells per experiment. *Denotes p < 0.05 vs. control, as assessed by a student’s t-test.

