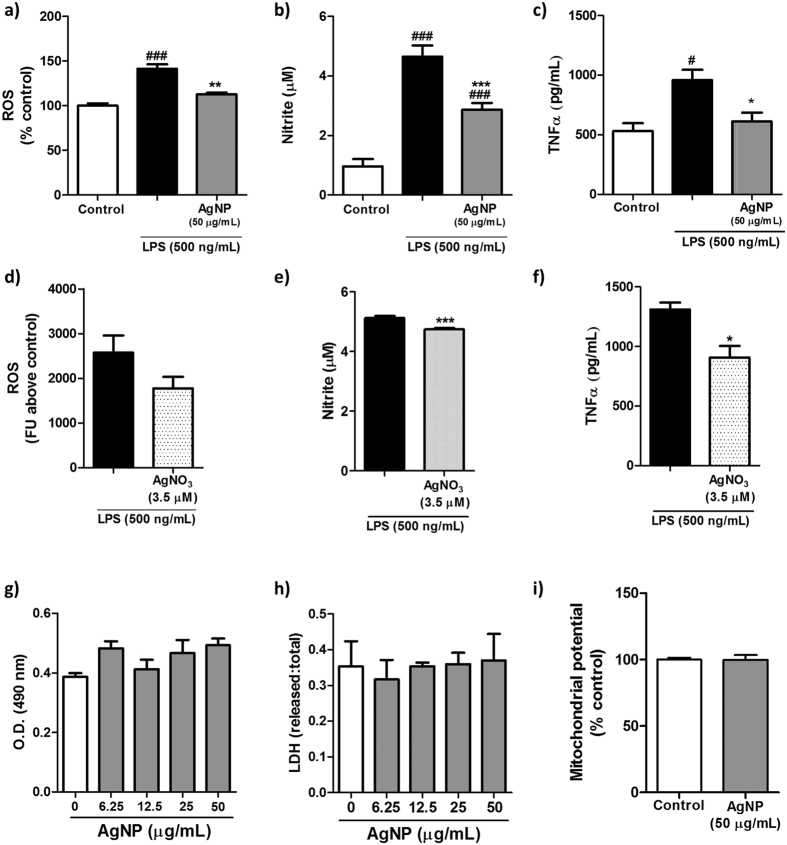
Figure 5. Modulation of microglial reactivity and cell viability by AgNP/AgNO3 treatment.
N9 microglial cells were treated with LPS (500 ng/mL) with or without AgNPs/AgNO3 for a 1 hr pulse period followed by a 24 hrs chase period. Microglial inflammation was assessed through quantification of (a,d) ROS production, (b,e) nitrite production, and (c,f) TNFα release. Cell viability was assessed through (g) an MTS assay, (h) LDH release assay, and (i) mitochondrial potential quantification. Data is presented as mean ± SEM of three independent experiments; #, ### indicate p < 0.05, 0.005, respectively, vs. control; *, ** and *** indicate p < 0.05, 0.01, 0.005, respectively, vs. LPS treatment as assessed by a one-way ANOVA with Tukey’s post-hoc test (a,b,c,g,h) or a student’s t-test (d,e,f,i).

