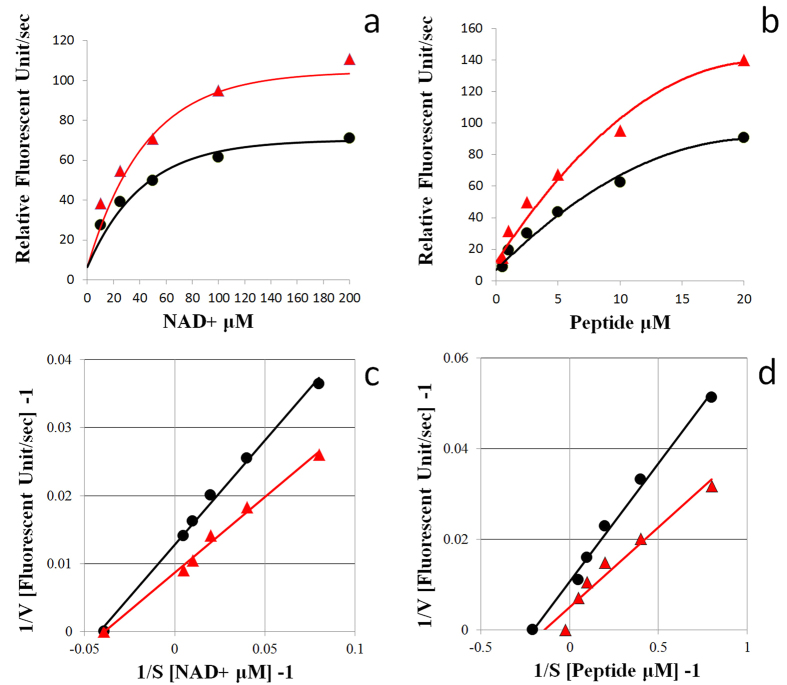
Figure 2.
Michaelis-Menten plot of C17:0-AR for SIRT1 activity with various concentrations (12.5–200 μM) of NAD+ at 1000 sec (a) and with various concentrations (0.5–20 μM) of peptide substrate at 1000 sec (b). Lineweaver-Burk plot of C17:0-AR for SIRT1 activity with various concentrations (12.5–200 μM) of NAD+ at 1000 sec (c) and with various concentrations (0.5–20 μM) of peptide substrate at 1000 sec (d). Black lines: control. Red lines: C17:0-AR. All values are the mean of at least three determinations.

