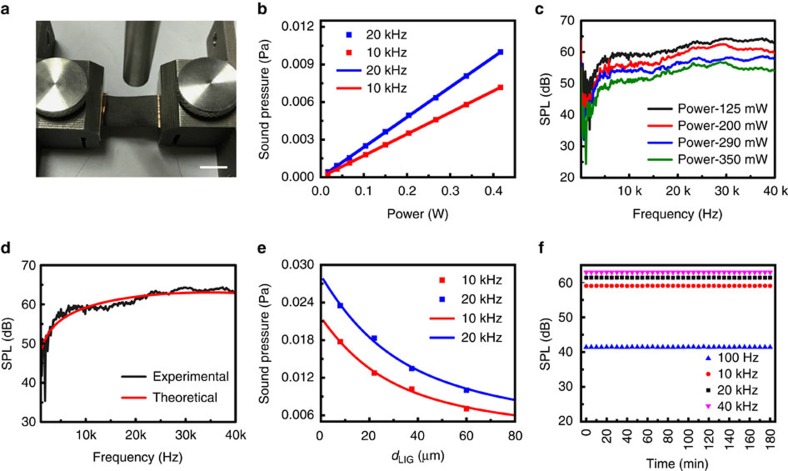
Figure 2. The performance of emitting sound.
(a) The LIG is clamped under a commercial microphone to test the performance of emitting sound. Scale bar, 1 cm. (b) The plot of the SP versus the input power at 10 and 20 kHz. The square is the experimental result and the line is the theoretical result. (c) The output SPL versus the frequency of LIG generated by the laser with different power. The four curves are normalized with the input power of 1 W. (d) The SPL versus the frequency showing that the model agrees well with experimental results. (e) The plot of the SP versus the thickness of LIG at 10 and 20 kHz. The square is the experimental result and the line is the theoretical result. (f) The stability of output SPL over time.

