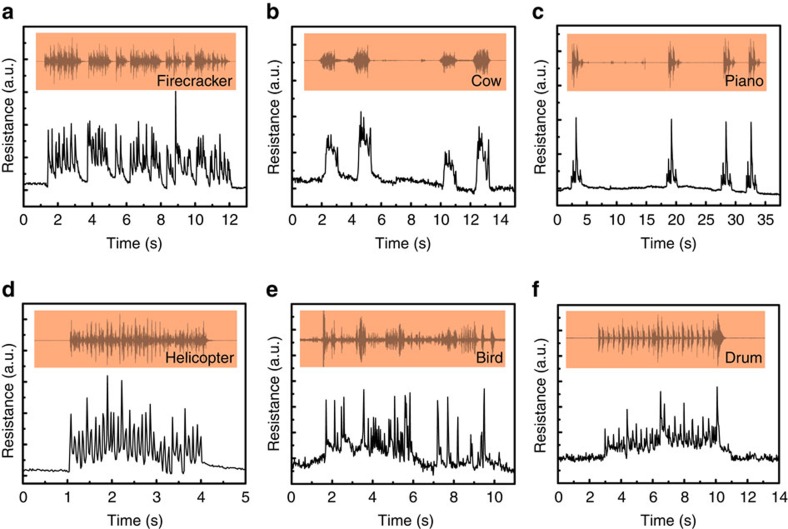
Figure 3. Responses towards different audios from a loudspeaker.
The LIG is placed 3 cm away from the loudspeaker. The orange insets above indicate the sound wave profiles of the original audios. Relative resistance changes show almost synchronous response to profiles of the original audios when the loudspeaker plays the audio of (a) firecrackers, (b) a cow, (c) a piano, (d) a helicopter, (e) a bird and (f) a drum.

