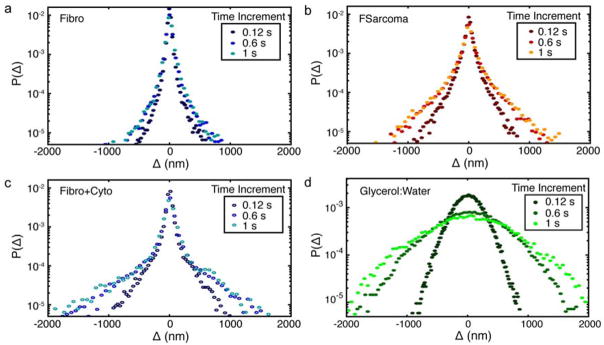
Figure 4.
van Hove distributions for QDs within (a) fibroblasts, (b) fibrosarcoma cells, (c) fibroblasts with cytochalasin D treatment, and (d) 90% glycerol:water solution at three time increments of 0.12 s, 0.6 s, and 1 s. Step size, Δ, combines steps in both × and y into a single van Hove distribution.

