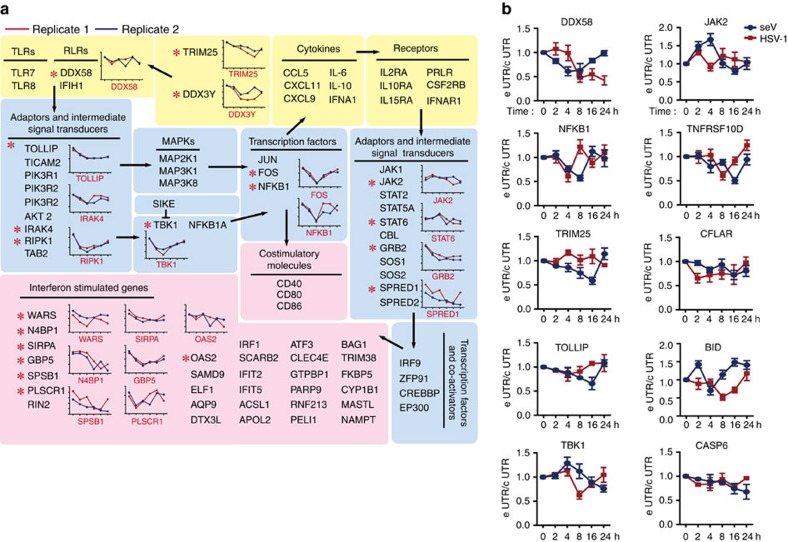
Figure 4. Genes with switched poly(A) sites involved in antiviral signalling network.
(a) The genes with APA involved in virus recognition and signal transduction were shown. The black arrows indicate signal transduction. The line graphs illustrate duplicate data, the x axis denotes six infection time points and the y axis denotes normalized 3′ UTR length. The yellow background indicates the cytokine and receptor layer, the blue background indicates the adaptor and intermediate signal transducer layer and the pink background indicates the terminal effectors. * Indicates the APA genes shown in the line graph. (b) Real-time PCR analysis of the selected genes with APA upon SeV or HSV-1 infection in THP-1 cells. The x axis denotes six time points post infection and the y axis denotes e UTR/c UTR, which represents the ratio of longer 3′ UTR isoforms to total mRNA isoforms. Data are presented as mean±s.d. of three independent experiments.

