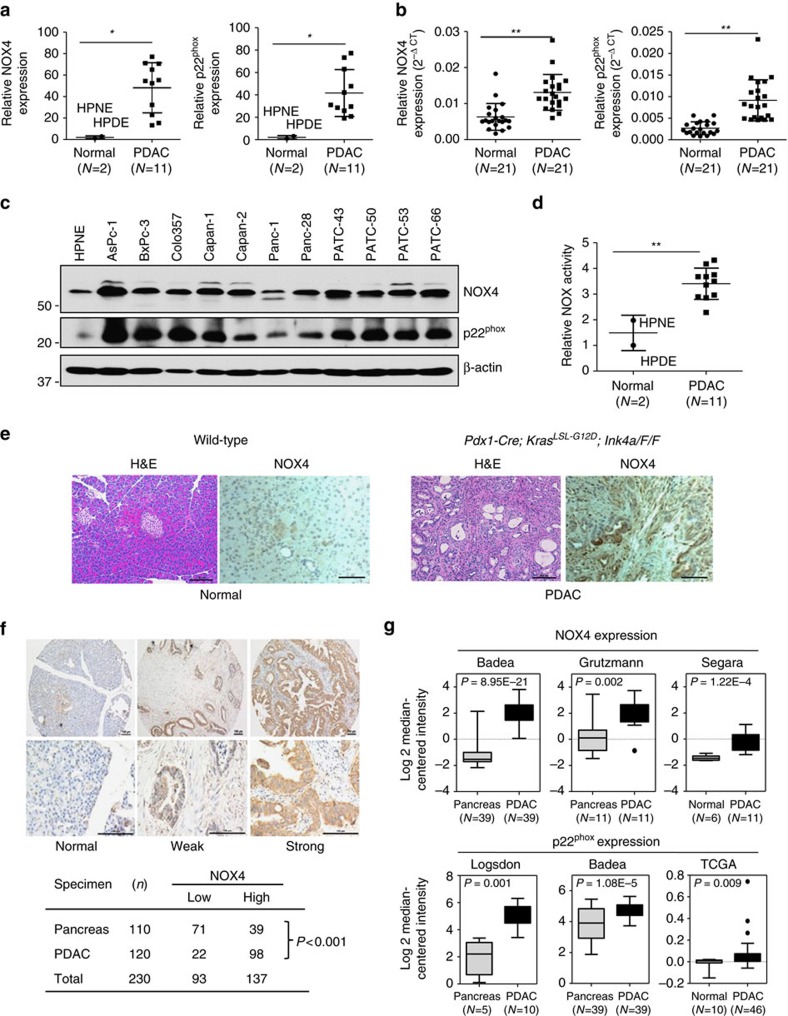
Figure 2. NOX4 and p22phox are overexpressed in PDAC.
(a) The mRNA levels of NOX4 and p22phox were compared between 11 PDAC cell lines and 2 normal cell lines. (b) The mRNA levels of NOX4 and p22phox were compared between PDAC tissues and adjacent normal tissues (N=21). (c) The expression of NOX4 and p22phox in different PDAC cell lines was analysed by immunoblotting and compared with that in HPNE cells. β-actin was included as a loading control. (d) NOX activity was compared between 11 PDAC cell lines and 2 normal cell lines. (e) Representative IHC staining with H&E or anti-NOX4 antibody in sections of formalin-fixed tissue from wild-type or Pdx1-Cre; KrasLSL-G12D, Ink4aF/F mice. (f) Representative IHC staining showing no expression of NOX4 in normal pancreas acinous cells, weak and strong positive staining (10 × ) in PDAC tissues. Lower panels represent higher magnifications (× 40). NOX4 expression is considered to be significantly different between PDAC and normal tissues and higher in PDAC group (P<0.0001 analysed by Fisher's exact test). Scale bars in e, f, 100 μm. (g) NOX4 and p22phox expression in multiple cancer microarray data sets available from Oncomine (https://www.oncomine.com//). Data in a,b,d are representative of three independent experiments and presented as mean±s.d. *P<0.05, **P<0.01 for indicated comparison (Student unpaired t-test). In g, box plot centre line and box limits represent median and interquartile range (IQR), respectively. Whisker lines represent data range (maximum and minimum) but not exceeding 1.5 × IQR from IQR. Data points beyond 1.5 × IQR from IQR are shown with circles.

