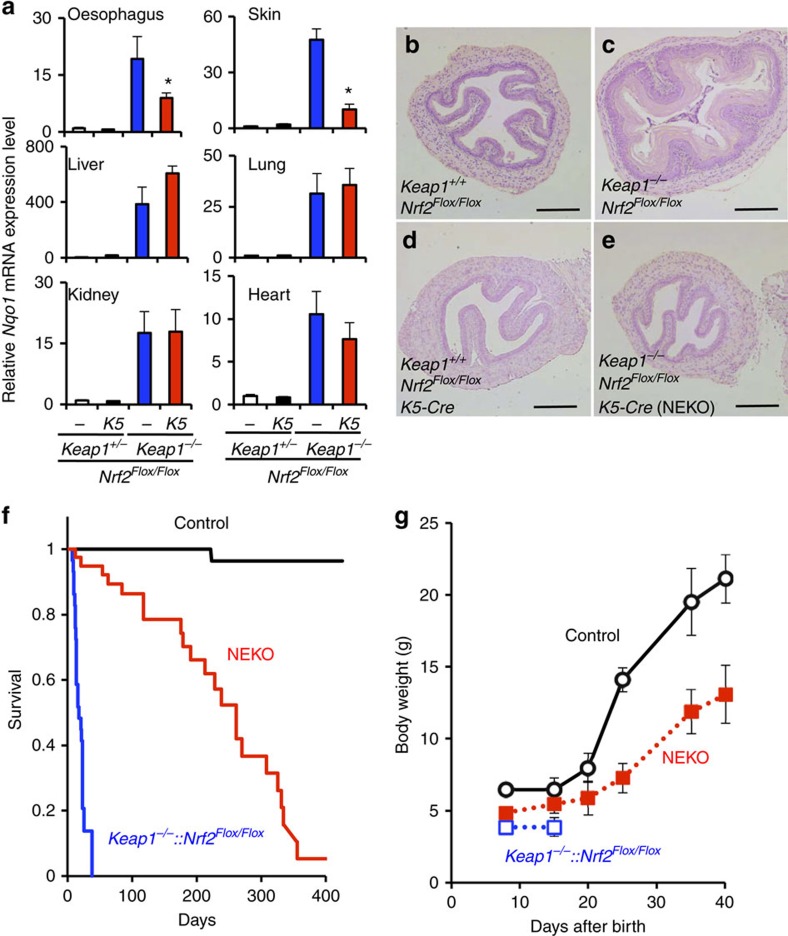
Figure 1. Generation of a mouse model that lacks Keap1 throughout the whole body and Nrf2 in the squamous epithelium.
(a) Relative Nqo1 gene expression level compared with Hprt expression in the oesophagus, skin, liver, lung, kidney and heart of mice at 10 days of age. Data are the means±s.e. (n=4). (*P<0.05 compared with Keap1−/−::Nrf2Flox/Flox, unpaired t-test) (b–e) Representative images of haematoxylin and eosin staining of transverse sections of the oesophagus from mice at 10 days of age (n=3). Scale bar, 100 μm. (f) Survival curve for control (n=56), Keap1−/−::Nrf2Flox/Flox (n=29) and NEKO (n=42) mice. (g) Growth curve for control (n=15), NEKO (n=10) and Keap1−/−::Nrf2Flox/Flox (n=16) mice. Data are the means±s.e.

