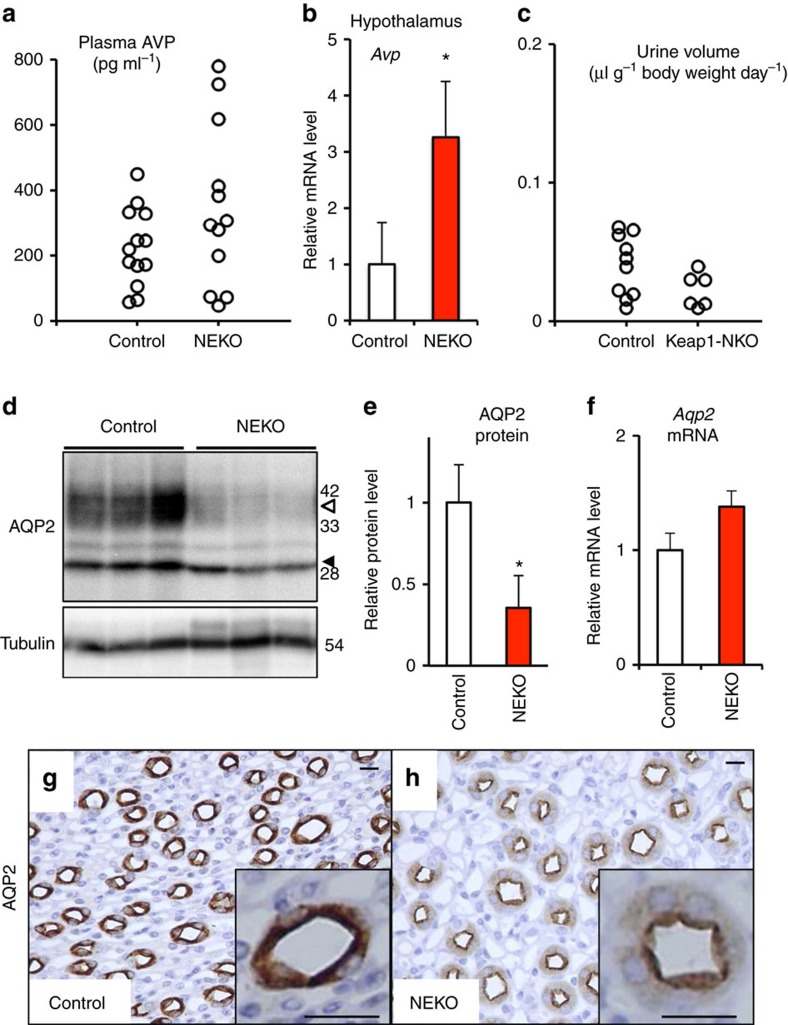
Figure 3. NEKO mice display nephrogenic diabetes insipidus.
(a) Plasma AVP level in control and NEKO mice. (b) Relative Avp gene expression level in the hypothalamus of control and NEKO mice. Data are the means±s.e. (n=4). (*P<0.05, unpaired t-test) (c) Urine volume of control and Keap1-NKO mice. (d) Western blotting analysis of AQP2 protein in the kidney of control and NEKO mice. Open and closed arrowheads indicate glycosylated and non-glycosylated forms of AQP2, respectively. The molecular weight standards are shown on the right. (e) Graphical representation of total AQP2 protein level shown in d. Data are the means±s.e. (n=3). (*P<0.05, unpaired t-test) (f) Relative Aqp2 gene expression level in the kidney of control and NEKO mice. Data are the means±s.e. (n=7). (g,h) AQP2 immunostaining of kidney sections of control and NEKO mice. Insets show a higher magnification view of the collecting duct. Scale bar, 10 μm.

