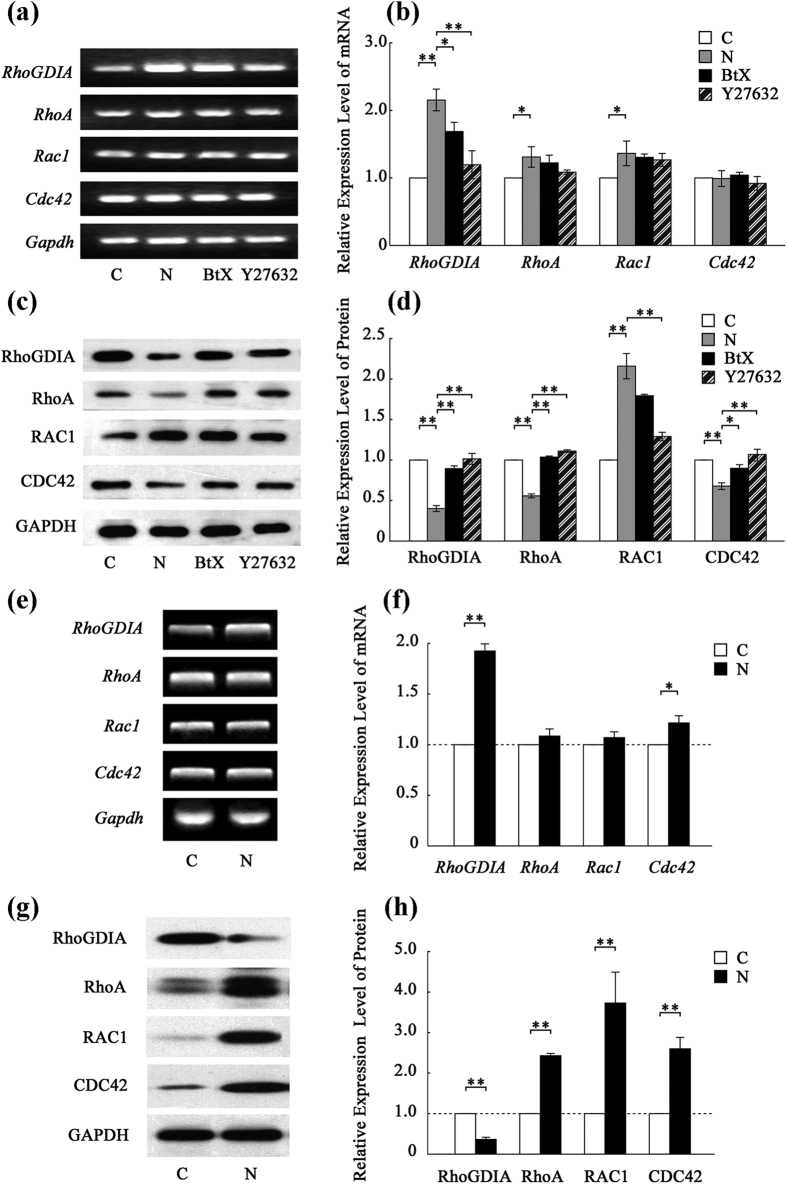
Figure 3. Detection of the expression levels of genes involved in the Rho GTPase pathway in vitro and in vivo.
(a) qRT-PCR analysis of the target gene transcripts in vitro. The results are shown in histogram (b). (c) Western blots of target proteins in vitro. The results are shown in histogram (d). (e) Semi-quantitative reverse transcription PCR analysis of target gene transcripts in vivo. The results are shown in histogram (f). (g) Western blots of target proteins in vivo. The results are shown in histogram (h). The values are expressed as the mean ± SEM (n = 5, *p < 0.05, **p < 0.01).

