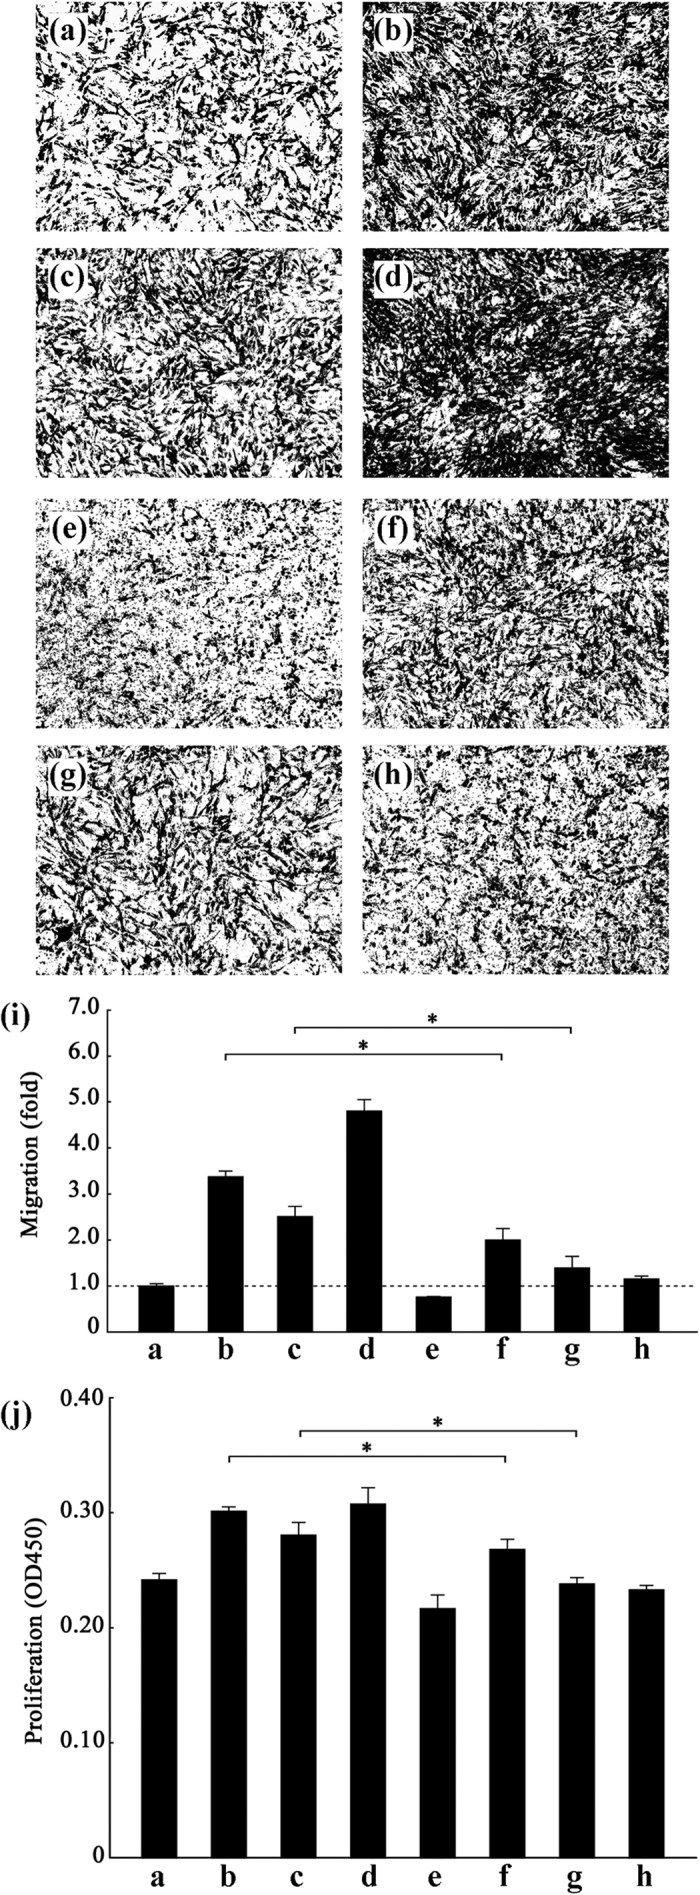
Figure 6. MiR-200b facilitates the migration and proliferation of VSMCs.

(a–h) Migration images. The number of cells, which is a measure of migration rate, was detected by a transwell migration assay Representative images at a magnification of 50X from three independent experiments are presented. The results are shown in histogram (i). (a) the control group; (b) VSMCs exposed to 10 μM nicotine for 24 h; (c) VSMCs transfected with miR-200b mimics (100 nmol/L); (d) VSMCs treated with miR-200b mimics (100 nmol/L) and nicotine; (e) VSMCs transfected with miR-200b (f) VSMCs treated with both miR-200b inhibitors (100 nmol/L) and nicotine; (g) VSMCs co-transfected with both miR-200b mimics and miR-200b inhibitors (100 nmol/L); (h) VSMCs transfected with scrambled miRNAs (100 nmol/L). The image of VSMCs treated with nicotine, miR-200b mimics (100 nmol/L) and miR-200b inhibitors (100 nmol/L) is shown in Supplementary Fig. S9. (j) A histogram of the CCK8 assay results from the eight groups. The values are expressed as the mean ± SEM (n = 5, *p < 0.05).
