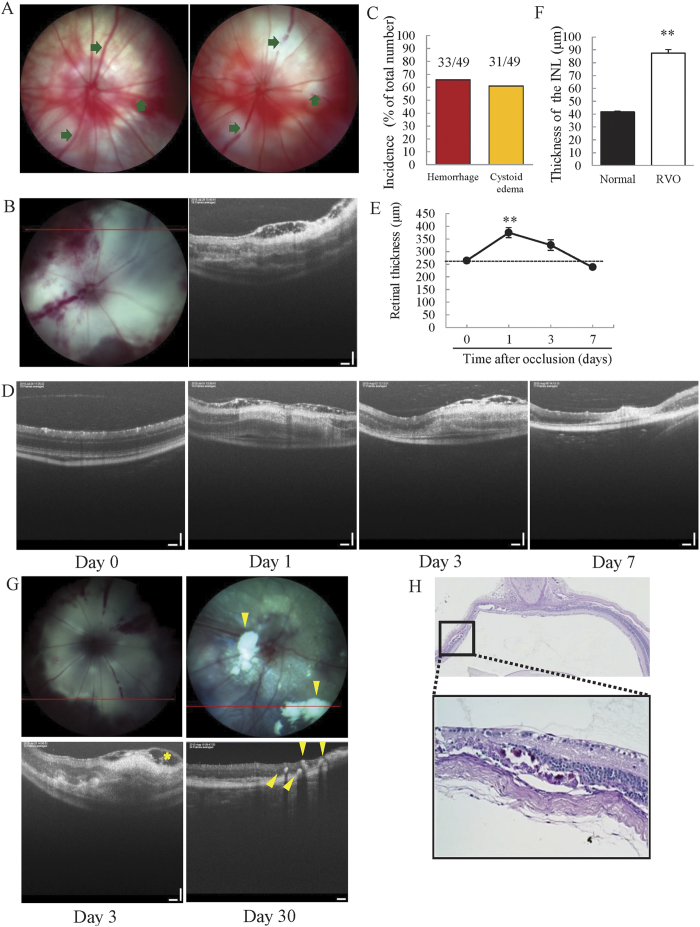
Figure 1. Both retinal haemorrhage and cystoid edema were observed in the experimental mouse model of RVO.
(A) Images of a non-laser irradiated retina (left) and a retina after laser irradiation (right). The arrows indicate occluded sites. (B) Fundus photography image (left) and OCT image (right), taken 3 days after photocoagulation. Haemorrhage and cystoid edema were observed (n = 49). (C) The incidences of haemorrhage and cystoid edema were 65.8% and 60.9%, respectively. (D) OCT images taken 0, 1, 3, and 7 days after photocoagulation. Cystoid edema was observed on days 1 and 3. (E) The plot below illustrates quantitative retinal thickness data. Retinal thickness was significantly increased on day 1 compared to day 0 and gradually recovered over the course of the experiment. Data are expressed as means ± S.E.M (n = 4–7). ##P < 0.01 vs. day 0 (Dunnett’s test). (F) Quantitative analysis of INL thickness 1 day after occlusion. INL thickness was significantly increased 1 day after occlusion. Data are expressed as means ± S.E.M (n = 4–7). ##P < 0.01 vs. day 0 (Student’s t-test). (G) RVO mice have white flecks (fundus photography) and hyper-reflective dots (OCT) in the INL and OPL. Hyper-reflective dots were present in the same areas where severe edema developed. Arrow head indicates hard exudates. (H) PAS-positive deposits were located in the INL and OPL. Scale bar represents 50 μm.

