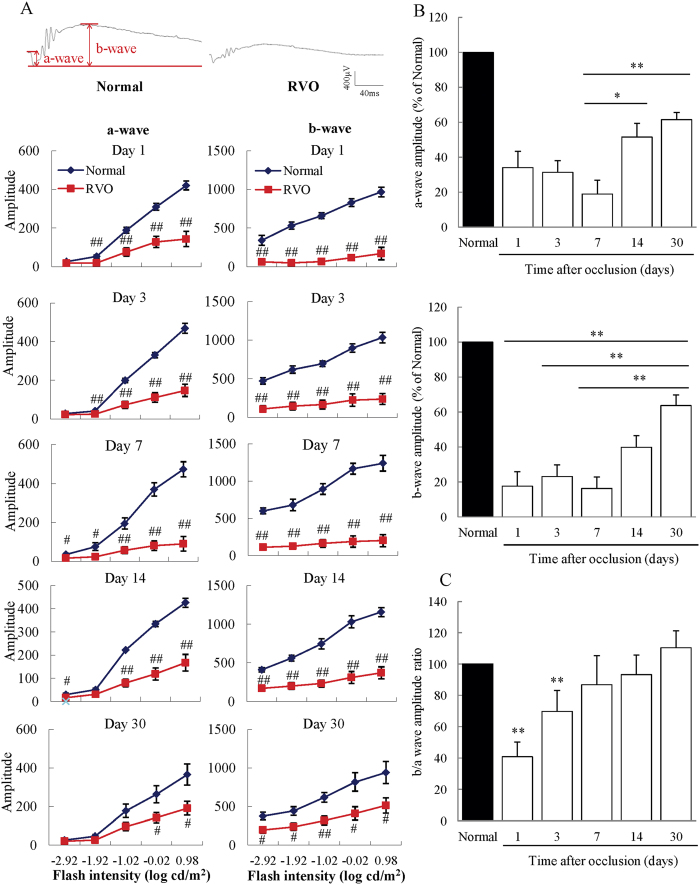
Figure 3. Significantly decreased b/a wave amplitude ratios in the RVO model.
(A) From days 1 to 30, both the a- and b-waves were dramatically decreased in RVO mice compared to untreated controls. Data are expressed as means ± S.E.M. (n = 3–7). ##P < 0.01, #P < 0.05 vs. untreated controls (Student’s t-test). (B) The decreased a-wave amplitude recovered significantly on days 14 and 30, compared to those on day 7. Moreover, the reduced b-wave amplitude recovered on day 30 compared to days 1, 3, and 7. Data are expressed as means ± S.E.M. **P < 0.01, *P < 0.05 (one-way ANOVA followed by Bonferroni’s post hoc comparison test). (C) The b/a wave amplitude ratio was significantly decreased on days 1 and 3 compared to untreated controls. The decreased b/a wave ratio recovered gradually and returned to a normal level by day 30. Data are expressed as means ± S.E.M. **P < 0.01, *P < 0.05 vs. untreated controls (Student’s t-test).

