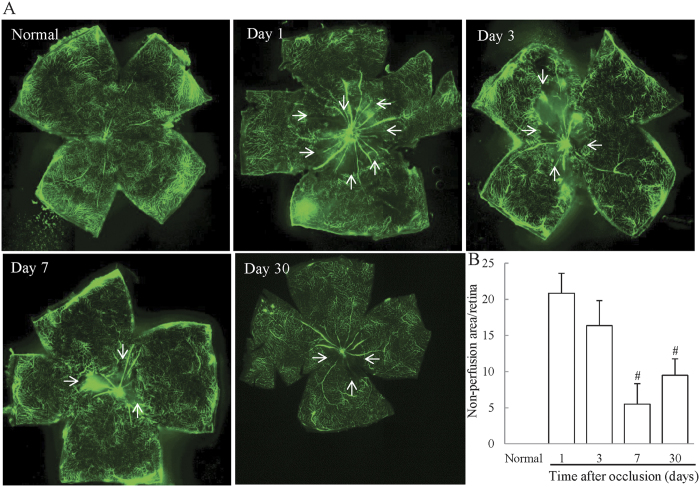
Figure 4. Retinal nonperfusion in the RVO model mouse.
(A) Representative images of flat-mounted retinas in untreated and RVO mice on days 1, 3, 7, and 30. Arrows = boundary of non-perfused area (B) Evaluation of the area of retinal nonperfusion using ImageJ software, demonstrating the development of retinal nonperfusion on days 1, 3, 7, and 30 after occlusion. The nonperfused areas on days 7 and 30 were significantly reduced compared to those on day1. Data are expressed as means ± S.E.M. (n = 4–6). *P < 0.05 vs RVO mice on day1 (one-way ANOVA followed by Bonferroni’s post hoc comparison test).

