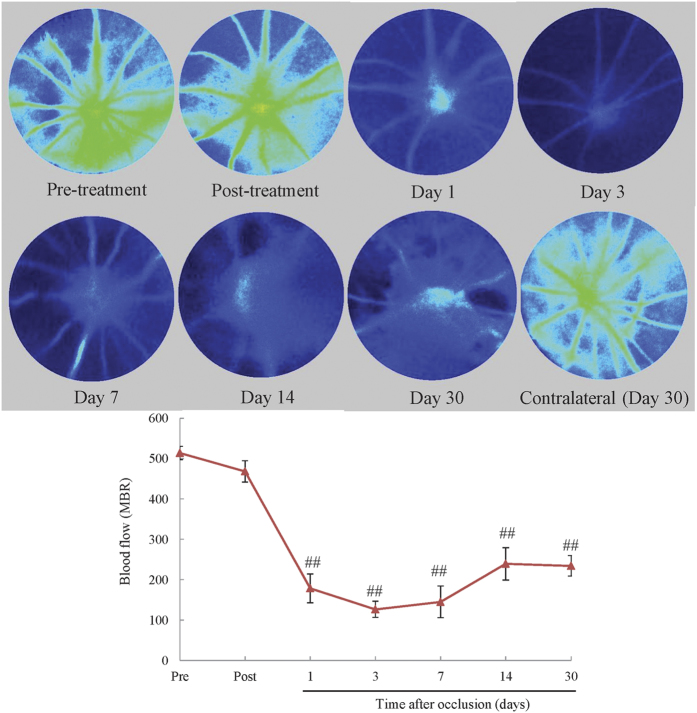
Figure 5. The reduction of blood flow persisted until day 30.
Blood flow was measured by LSFG before and immediately after occlusion, and on days 1, 3, 7, 14, and 30 to verify the duration of the reduction of blood flow. Blood flow was significantly reduced compared to the pre-treatment group 1, 3, 7, 14, and 30 days after occlusion. The data are expressed as means ± S.E.M. (n = 5–8). ##P < 0.01 vs pre-treatment group (Dunnett’s test).

