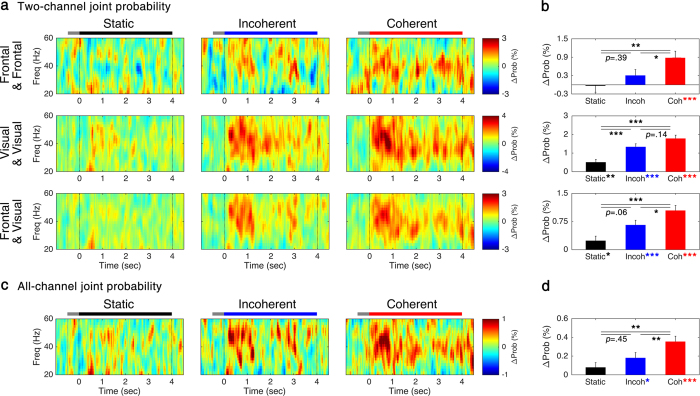
Figure 3. Joint probability matrix.
(a) Two-channel joint probability matrix of each pair of electrodes and (c) all-channel joint probability matrix and (b,d) its average of 30–50 Hz components within 0.5–4 s, respectively. The black, blue, and red lines indicate the period of stimulus presentation, and gray lines indicate fixation period. Error bars represent SEM. *p < 0.05; **p < 0.01; ***p < 0.001.

