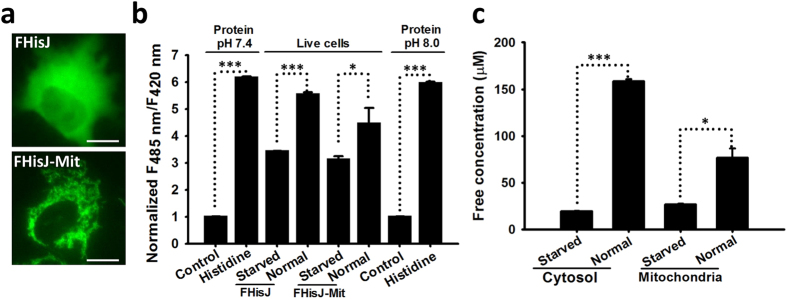
Figure 3. Subcellular Distribution of Histidine in Mammalian Cells.
(a) Fluorescence images of FHisJ sensor targeted to cytosol (top) and mitochondria (bottom). Scale bar, 10 μm. (b) Normalized ratio of FHisJ and FHisJ-Mit fluorescence excited at 485 nm to that at 420 nm in glucose-deprived or glucose-fed cells and measured in vitro with a fluorescence plate reader in the presence or absence of 1 mM histidine. Cells were deprived of glucose for 2 h. Error bars represent SD. (c) Quantification of cytosolic and mitochondrial free-histidine level in glucose-deprived or glucose-fed cells according to the FHisJ and FHisJ-Mit fluorescence data in Fig. 3b. *p < 0.05, and ***p < 0.001. For (b and c), data are presented three biological replicates, and error bars represent SD.

