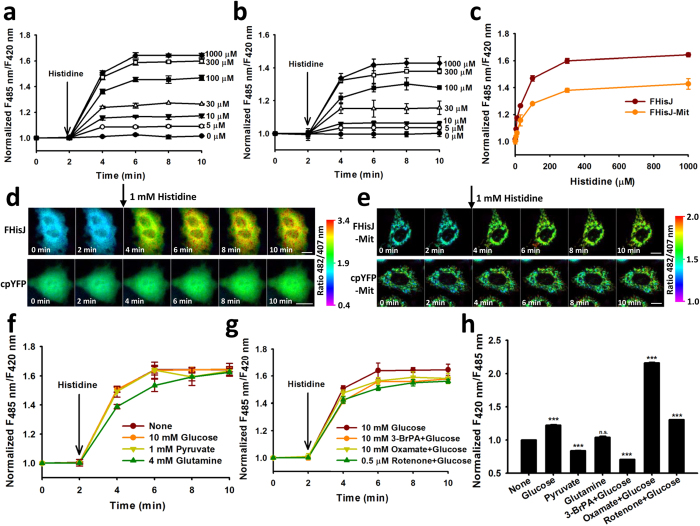
Figure 4. Subcellular Transport of Histidine in Mammalian Cells.
(a and b) Kinetics of FHisJ (a) and FHisJ-Mit (b) fluorescence responses in Hela cells treated with exogenous histidine. (c) Fluorescence responses of FHisJ and FHisJ-Mit in Hela cells after histidine addition for 8 min. (d and e) Spatiotemporally resolved changes in the ratiometric fluorescence of FHisJ (d, top), cpYFP (d, bottom), FHisJ-Mit (e, top), and cpYFP-Mit (e, bottom) in sequential frames (left to right, 2 min/frame) in response to 1 mM histidine in Hela cells. Images were pseudocolored with the ratio of fluorescence excited at 482 and 407 nm. Scale bar, 10 μm. For (a–e), cells were starved in HBSS for 2 h. (f) Effect of different nutrients on histidine transport across plasma membrane. Cells expressing FHisJ were incubated with or without indicated nutrients for 2 h and then treated with 1 mM histidine. (g) Effect of glycolysis inhibitors and mitochondtial inhibitor on histidine transport across plasma membrane. Cells were treated with inhibitors for 30 min. (h) Effect of different nutrients, glycolysis inhibitors, and mitochondrial inhibitor on cytosolic metabolic state assessed by SoNar sensor. Experimental condition was the same as those of (f and g). ***p < 0.001. For (a–c, f and g), FHisJ or FHisJ-Mit fluorescence were corrected for pH effect by normalization with cpYFP or cpYFP-Mit fluorescence measured in parallel experiments. For (a–c and f–h), data are presented three (a–c, f and g) or six (h) biological replicates, error bars represent SEM. (see also Supplementary Figure 2).

