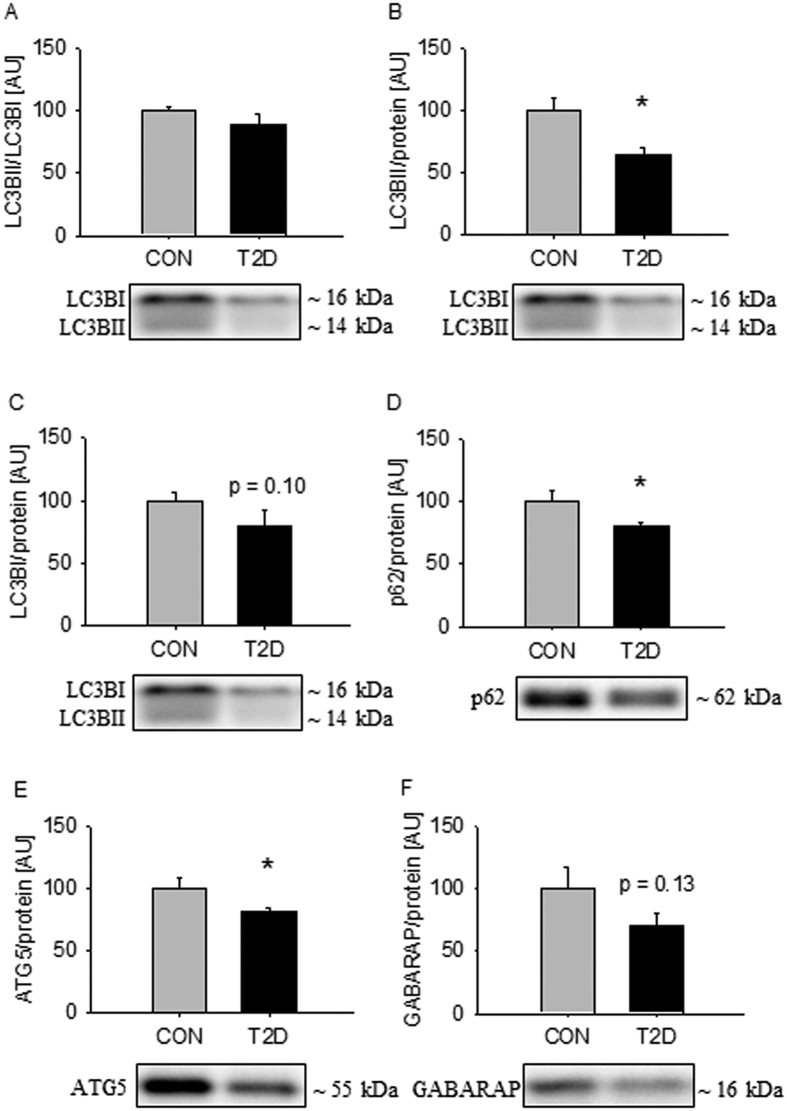
Figure 2. Autophagy-related protein expression is repressed in skeletal muscle from T2D patients.
The ratio of LC3BII to LC3BI was equal in the two groups (A). Separate analysis of LC3BII and LC3BI showed that LC3BII was decreased in the diabetics (B), but the difference in LC3BI did not reach statistical significance (C). p62 and ATG5 were decreased in the patients (D,E). GABARAP was decreased in the patients, but the difference did not reach statistical significance (F). Values are means ± SEM. *Indicate difference in the mean values based on Student’s t-test. Representative western bots are shown below the graphs. Based on the applied molecular standards, approximated molecular weights are indicated on the right.

