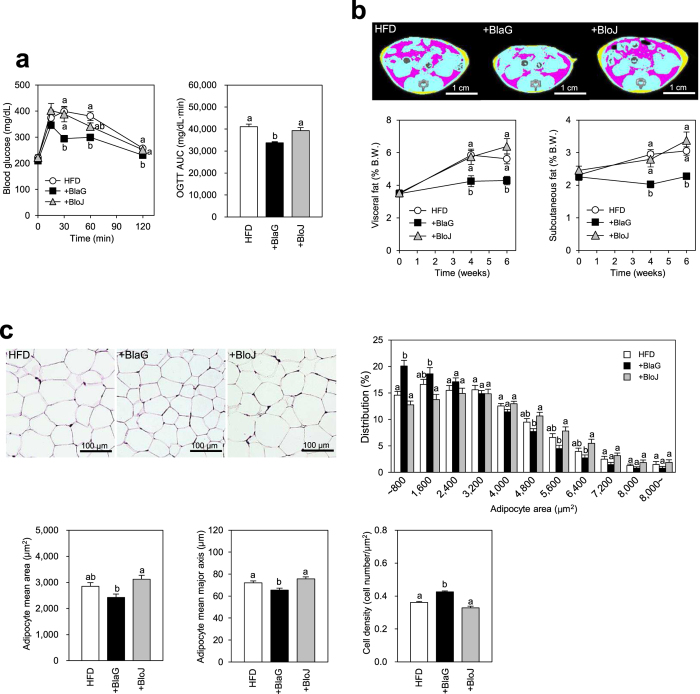
Figure 2. Comparison of the BlaG treatment and Bifidobacterium longum JCM1217T (BloJ) treatment to improve glucose tolerance and body fat accumulation in HFD mice (Experiment 2).
(a) Blood glucose levels and the area under the curve after oral glucose challenge (2 g/kg body weight) after the bifidobacteria treatment for 6 weeks. (b) Representative computed tomography (CT) images after 6 weeks of probiotic treatments and serial assessment of CT-estimated proportions of visceral and subcutaneous fat weight to body weight after 0–6 weeks of probiotic treatment. The pink and yellow areas in CT images represent the visceral and subcutaneous fat, respectively. (c) Representative epididymal fat tissue staining, cell area distribution, mean area, mean major axis, and cell density of epididymal adipocytes after 7 weeks of bifidobacteria treatments. Data represent the mean ± SEM. Statistical analyses were performed using the Tukey–Kramer multiple comparison test. Different letters next to bars indicate a significant difference (P < 0.05).

