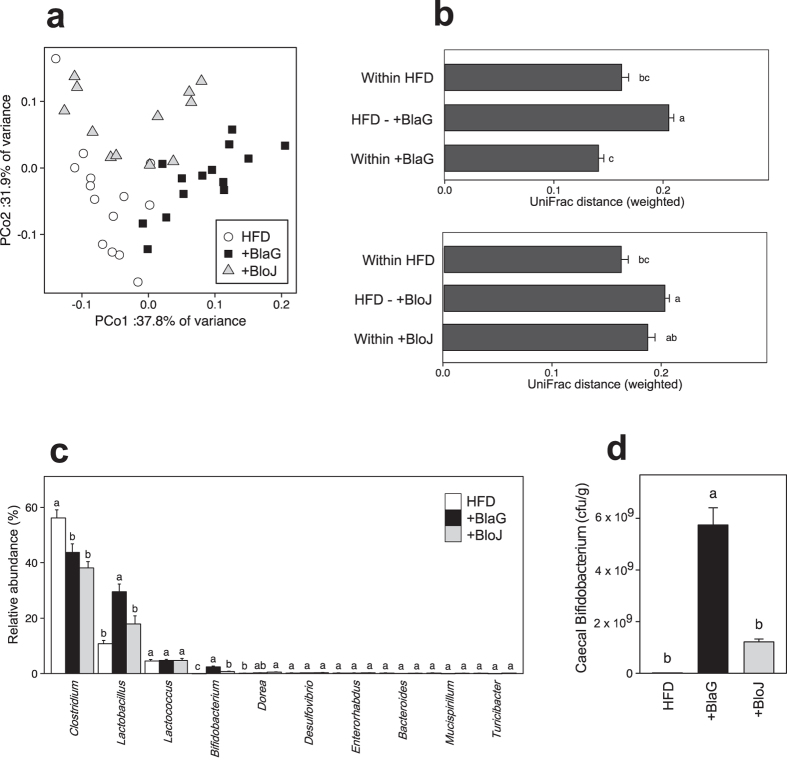
Figure 3. Analysis of the microbiota in the contents of the caecum.
(a) Principal coordinate analysis plot generated using a weighted UniFrac metric. The two components explained 69.7% of the variance. (b) Weighted UniFrac distance metric in the HFD-fed control, the BlaG-treated, and the BloJ-treated groups. (c) Bacterial composition at the genus level in the samples. For genus-level assignment of 16 S reads (16 S rRNA gene V1–V2 region), a 94% sequence identity threshold was applied. The vertical axis represents the relative abundance (%) of each genus in the microbiota. (d) The number of Bifidobacterium in caecal samples quantified by quantitative polymerase chain reaction. Data represent the mean ± SEM. Tukey–Kramer multiple comparison test was used. Different letters next to bars indicate a significant difference (P < 0.05).

