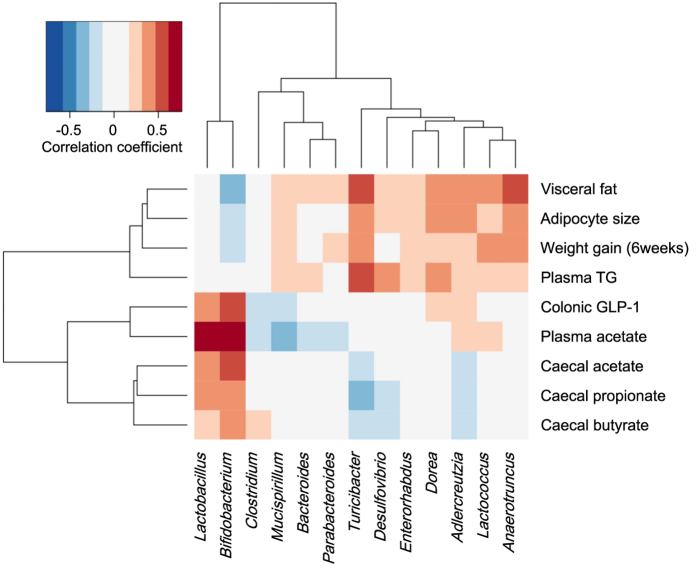
Figure 5. Correlation between the relative abundance of genera and metabolic parameters in mice.
Pearson’s correlation coefficients are represented by colour ranging from blue (negative correlation, −1) to red (positive correlation, 1). Data on genus reads used for the analysis represented 73.7% of the total reads of microbiota.

