Fig. 2.

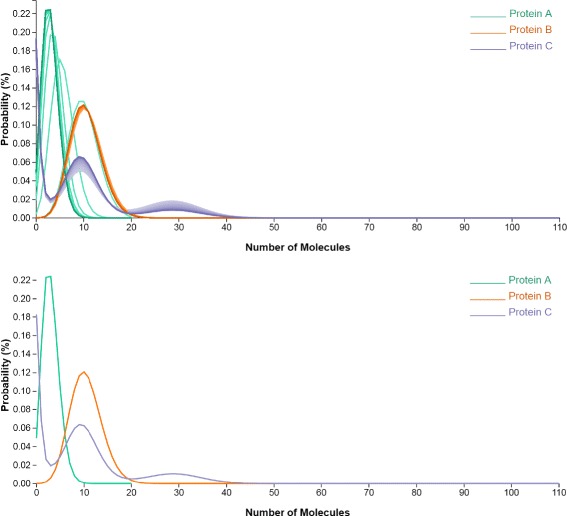
Spaghetti Plots (top) show the probability distribution of each gene and the changes in distributions over time. The Spaghetti Plots view on the bottom displays the probability distribution of each gene at a user selected time step

Spaghetti Plots (top) show the probability distribution of each gene and the changes in distributions over time. The Spaghetti Plots view on the bottom displays the probability distribution of each gene at a user selected time step