Fig. 4.

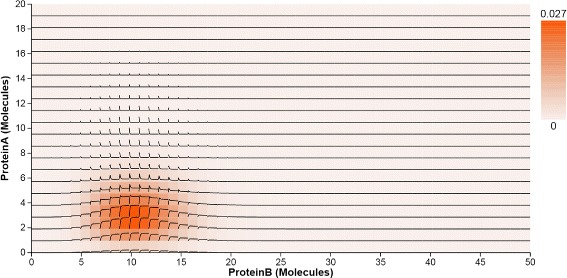
The 2D heatmap displays the probability distribution over the 2D state space projected for the pair of Pa and Pb. Time Curves overlaid on the 2D heatmap indicate how the probability values in the 2D state space change over time

The 2D heatmap displays the probability distribution over the 2D state space projected for the pair of Pa and Pb. Time Curves overlaid on the 2D heatmap indicate how the probability values in the 2D state space change over time