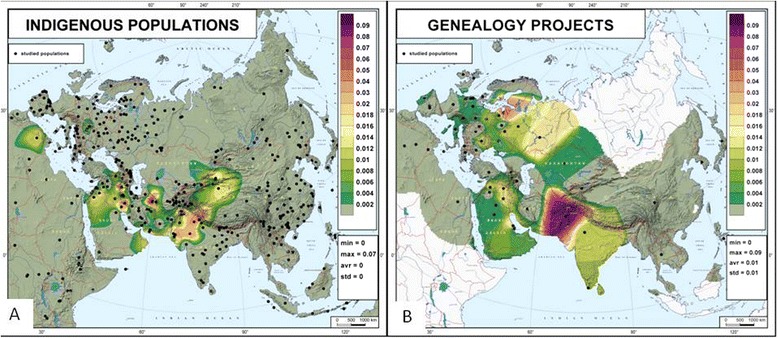
Fig. 2.

Frequency distribution map of haplogroup Q3-L275. a Data from indigenous populations from academic papers (total sample size 11,566). b Data from genealogical projects (Jewish projects not included, total sample size 23,730). The plotted frequencies were calculated as number of Q3-L275 carriers in the corresponding genealogical project divided to the total number of persons in the project
