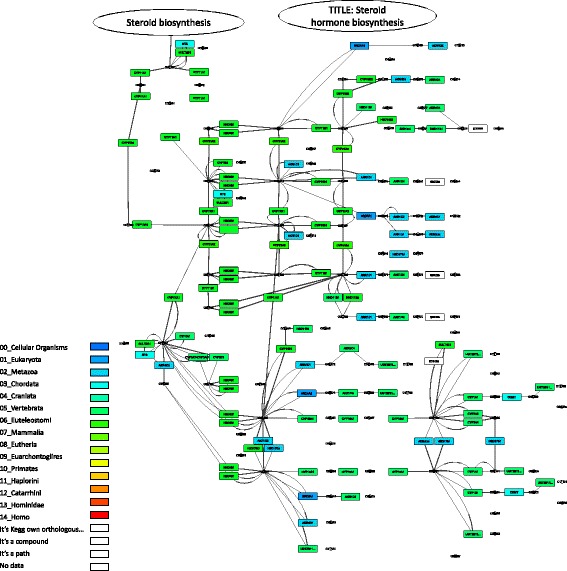
Fig. 4.

KEGG steroid hormone biosynthesis pathway. Visualization of the KEGG steroid hormone biosynthesis pathway (ko00140) by the Orthoscape application using PAI heatmap color scheme. Gene node colors correspond to PAI values from smaller (PAI = 1, older genes, blue color) to larger (PAI = 7, young genes, green color)
