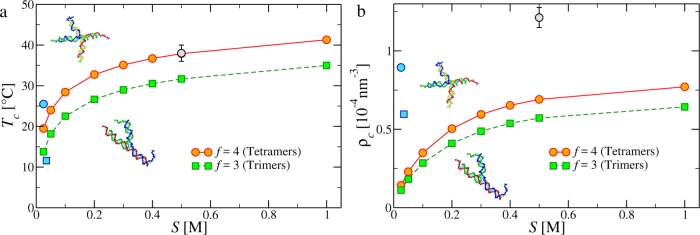
Figure 4.
Gas–liquid (a) critical temperatures and (b) critical densities as functions of the salt concentration for DNA tetramers (circles) and trimers (squares). Red and green symbols and lines refer to the theoretical estimates (see the Methods). Blue circles and squares are experimental values for tetramers and trimers, respectively, from ref (17); the gray circle is a numerical estimate from ref (36).

